## Line Graph: EGA Convergence Across Environment Steps
### Overview
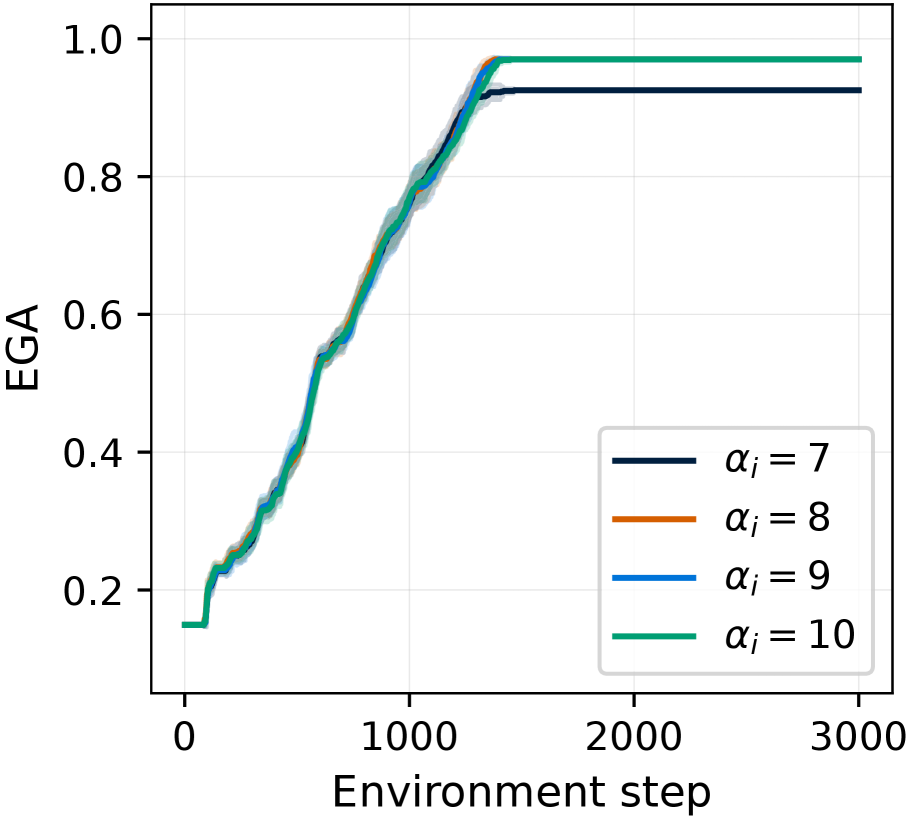
The image depicts a line graph illustrating the convergence of Expected Goal Achievement (EGA) values across different environment steps for four distinct α (alpha) parameter settings. The graph shows four colored lines representing α values of 7, 8, 9, and 10, with shaded regions indicating uncertainty bounds. All lines plateau at high EGA values after approximately 1,500 environment steps.
### Components/Axes
- **Y-axis (EGA)**: Ranges from 0.0 to 1.0 in increments of 0.2. Represents the Expected Goal Achievement metric.
- **X-axis (Environment step)**: Ranges from 0 to 3,000 in increments of 1,000. Represents sequential training steps in an environment.
- **Legend**: Located in the bottom-right corner, mapping colors to α values:
- Black: α = 7
- Orange: α = 8
- Blue: α = 9
- Green: α = 10
- **Shaded Regions**: Gray bands around each line indicate uncertainty estimates, with width decreasing as environment steps increase.
### Detailed Analysis
1. **α = 7 (Black Line)**:
- Starts at ~0.15 EGA at 0 steps.
- Gradually increases to ~0.95 EGA by 2,000 steps.
- Plateaus with minimal fluctuation beyond 2,000 steps.
- Uncertainty band widest at early steps (~0.1–0.2 range), narrowing to ±0.02 by 3,000 steps.
2. **α = 8 (Orange Line)**:
- Begins slightly higher (~0.18 EGA) than α = 7.
- Reaches ~0.97 EGA by 2,000 steps.
- Maintains a stable plateau with uncertainty band narrowing to ±0.015 by 3,000 steps.
3. **α = 9 (Blue Line)**:
- Initial EGA ~0.22 at 0 steps.
- Accelerates to ~0.98 EGA by 1,500 steps.
- Uncertainty band reduces to ±0.01 by 3,000 steps.
4. **α = 10 (Green Line)**:
- Highest starting EGA (~0.25).
- Rapidly converges to 1.0 EGA by 1,200 steps.
- Uncertainty band collapses to ±0.005 by 3,000 steps.
### Key Observations
- **Convergence Pattern**: All α values exhibit rapid EGA growth in early steps, with diminishing returns after ~1,500 steps.
- **α Sensitivity**: Higher α values achieve higher plateau EGA (α = 10 reaches 1.0 vs. α = 7 at 0.95).
- **Uncertainty Trends**: Confidence intervals shrink significantly with more environment steps, suggesting improved model stability.
- **Line Proximity**: Lines for α = 8–10 overlap closely after 2,000 steps, indicating similar performance at high α thresholds.
### Interpretation
The graph demonstrates that increasing α accelerates EGA convergence and achieves higher maximum values. The shaded uncertainty regions imply that early training is less reliable, with models stabilizing after ~1,500 steps. The near-identical performance of α = 8–10 at 3,000 steps suggests diminishing returns for α > 9. This could indicate an optimal α range for balancing computational cost and performance. The rapid rise in EGA for α = 10 (green line) implies that higher α values may prioritize goal achievement at the expense of other factors (e.g., exploration efficiency), warranting further investigation into trade-offs.