## Line Chart: EGA vs. Environment Step for Different Alpha Values
### Overview
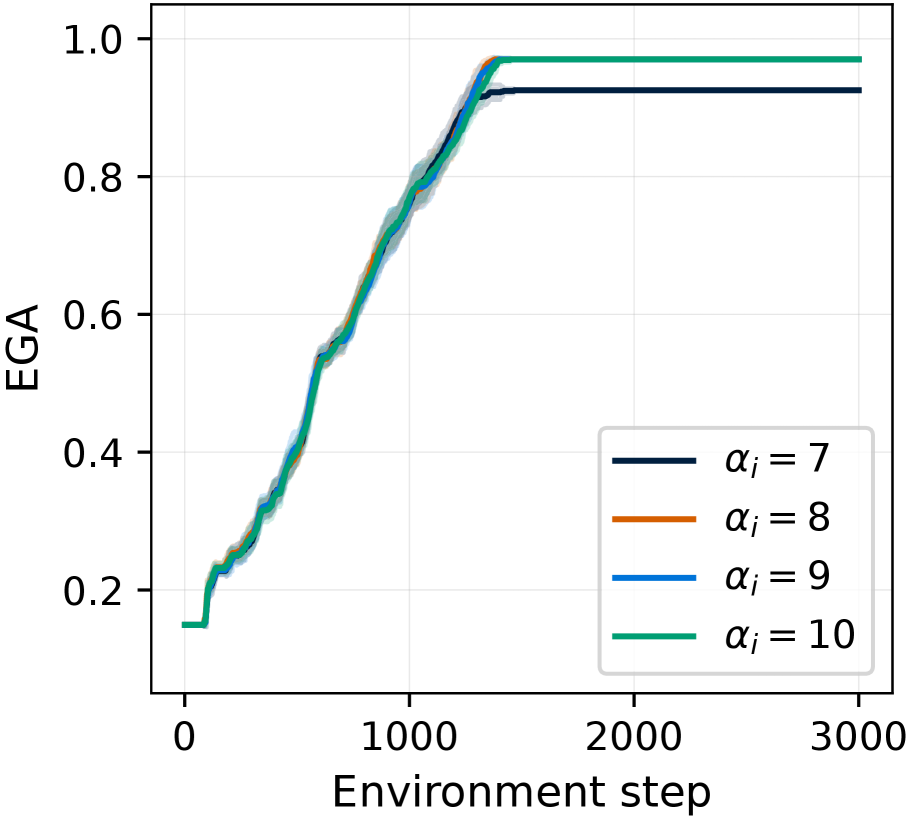
The image is a line chart that plots the Expected Goal Achievement (EGA) against the Environment Step for four different values of alpha (α): 7, 8, 9, and 10. The chart shows how the EGA changes over time (environment steps) for each alpha value. The legend is located in the bottom-right corner of the chart.
### Components/Axes
* **X-axis:** Environment step, ranging from 0 to 3000 in increments of 1000.
* **Y-axis:** EGA (Expected Goal Achievement), ranging from 0.2 to 1.0 in increments of 0.2.
* **Legend:** Located in the bottom-right corner, indicating the alpha values:
* Dark Blue: αᵢ = 7
* Orange: αᵢ = 8
* Blue: αᵢ = 9
* Teal: αᵢ = 10
### Detailed Analysis
* **αᵢ = 7 (Dark Blue):** The EGA starts at approximately 0.2, increases steadily until around environment step 1500 where it reaches approximately 0.95, and then plateaus at approximately 0.95 for the remainder of the steps.
* **αᵢ = 8 (Orange):** The EGA starts at approximately 0.15, increases steadily until around environment step 1500 where it reaches approximately 0.95, and then plateaus at approximately 0.95 for the remainder of the steps.
* **αᵢ = 9 (Blue):** The EGA starts at approximately 0.15, increases steadily until around environment step 1500 where it reaches approximately 0.97, and then plateaus at approximately 0.97 for the remainder of the steps.
* **αᵢ = 10 (Teal):** The EGA starts at approximately 0.15, increases steadily until around environment step 1500 where it reaches approximately 0.98, and then plateaus at approximately 0.98 for the remainder of the steps.
### Key Observations
* All four alpha values show a similar trend: a rapid increase in EGA up to around 1500 environment steps, followed by a plateau.
* Higher alpha values (9 and 10) achieve slightly higher EGA plateaus compared to lower alpha values (7 and 8).
* The shaded regions around each line indicate the variance or uncertainty in the EGA values.
### Interpretation
The chart suggests that increasing the alpha value generally leads to a slightly higher Expected Goal Achievement. However, the difference in EGA between the different alpha values is relatively small, especially after the initial learning phase (up to 1500 environment steps). The plateauing of EGA indicates that after a certain number of environment steps, further training does not significantly improve the agent's performance, regardless of the alpha value. The alpha values of 9 and 10 appear to perform slightly better than 7 and 8.