\n
## Line Chart: EGA vs. Environment Step for Different Alpha Values
### Overview
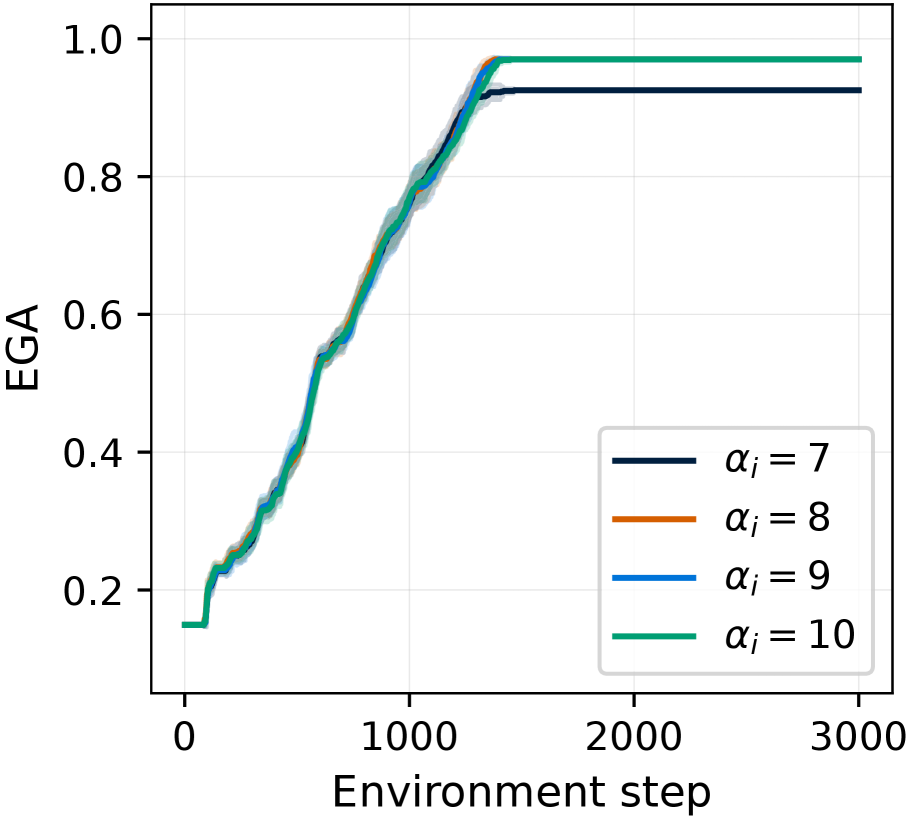
This image presents a line chart illustrating the relationship between EGA (presumably a performance metric) and the number of environment steps, for four different values of αᵢ (alpha i). The chart shows how EGA evolves over time for each alpha value.
### Components/Axes
* **X-axis:** "Environment step" ranging from approximately 0 to 3000.
* **Y-axis:** "EGA" ranging from approximately 0.0 to 1.0.
* **Legend:** Located in the top-right corner, it identifies four lines, each corresponding to a different αᵢ value:
* αᵢ = 7 (Black line)
* αᵢ = 8 (Gray line)
* αᵢ = 9 (Orange line)
* αᵢ = 10 (Teal line)
* **Grid:** A light gray grid is present, aiding in reading values from the chart.
### Detailed Analysis
The chart displays four lines, each representing the change in EGA over environment steps for a specific αᵢ value.
* **αᵢ = 7 (Black Line):** The line starts at approximately 0.15 at Environment step 0. It increases steadily until around Environment step 800, where it begins to plateau. It reaches approximately 0.95 at Environment step 1500 and remains relatively stable around 0.97-0.99 for the rest of the range.
* **αᵢ = 8 (Gray Line):** This line begins at approximately 0.16 at Environment step 0. It shows a similar trend to αᵢ = 7, but with a slightly slower initial increase. It reaches approximately 0.94 at Environment step 1400 and stabilizes around 0.97-0.99.
* **αᵢ = 9 (Orange Line):** Starting at approximately 0.17 at Environment step 0, this line exhibits a faster initial increase compared to αᵢ = 7 and αᵢ = 8. It reaches approximately 0.96 at Environment step 1300 and stabilizes around 0.98-0.99.
* **αᵢ = 10 (Teal Line):** This line starts at approximately 0.18 at Environment step 0. It demonstrates the fastest initial increase among all four lines. It reaches approximately 0.97 at Environment step 1200 and stabilizes around 0.98-0.99.
All four lines converge towards a similar EGA value (around 0.97-0.99) as the number of environment steps increases.
### Key Observations
* The lines show a clear upward trend, indicating that EGA generally increases with the number of environment steps.
* Higher αᵢ values lead to faster initial increases in EGA.
* The lines converge as the number of environment steps increases, suggesting that the impact of αᵢ diminishes over time.
* There is a slight difference in the final EGA values achieved by each αᵢ value, with αᵢ = 9 and αᵢ = 10 achieving slightly higher values than αᵢ = 7 and αᵢ = 8.
### Interpretation
The data suggests that the parameter αᵢ plays a role in the initial learning or performance rate, with higher values leading to faster progress. However, the convergence of the lines indicates that the long-term performance is less sensitive to the initial αᵢ value. This could imply that the system reaches a saturation point where further increases in αᵢ do not significantly improve EGA. The EGA metric likely represents some form of accumulated reward or performance score within the environment. The environment steps represent the progression of the agent's interaction with the environment. The chart demonstrates how different learning rates (controlled by αᵢ) affect the speed at which the agent learns and optimizes its performance. The convergence suggests that the environment presents a limited learning opportunity, and the agent eventually reaches a point of diminishing returns regardless of the initial learning rate.