## Horizontal Bar Chart: E-CARE: Avg. Proof Depth
### Overview
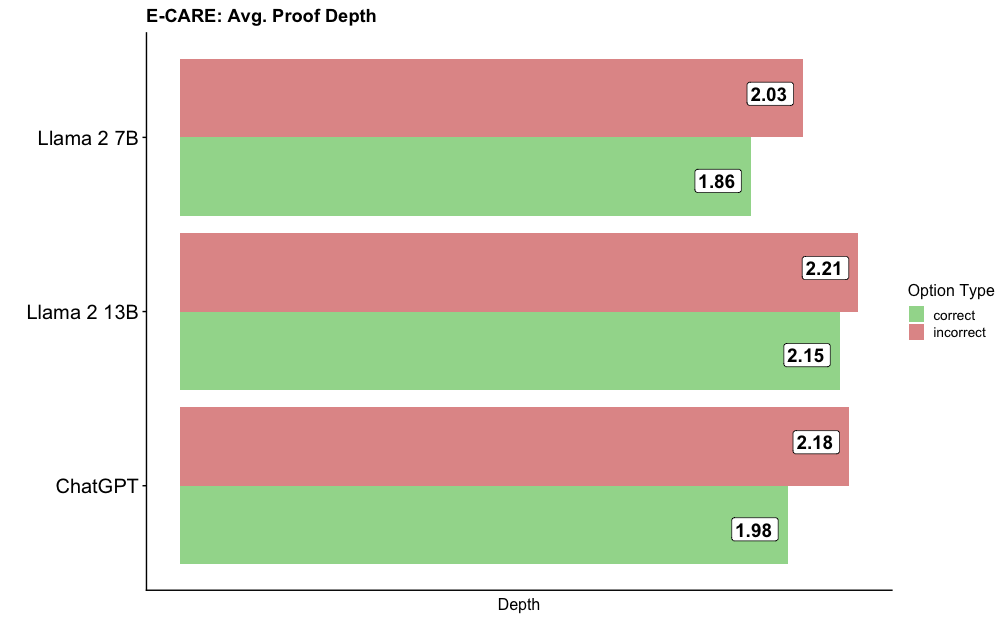
The image is a horizontal bar chart comparing the average proof depth of three different language models (Llama 2 7B, Llama 2 13B, and ChatGPT) on the E-CARE benchmark. The chart displays the average proof depth for both correct and incorrect answers, indicated by green and red bars, respectively.
### Components/Axes
* **Title:** E-CARE: Avg. Proof Depth
* **Y-axis Labels (Models):** Llama 2 7B, Llama 2 13B, ChatGPT
* **X-axis Label:** Depth
* **Legend (Option Type):**
* Green: correct
* Red: incorrect
### Detailed Analysis
The chart presents the average proof depth for each model, separated by whether the answer was correct or incorrect.
* **Llama 2 7B:**
* Correct (green): 1.86
* Incorrect (red): 2.03
* **Llama 2 13B:**
* Correct (green): 2.15
* Incorrect (red): 2.21
* **ChatGPT:**
* Correct (green): 1.98
* Incorrect (red): 2.18
### Key Observations
* For all three models, the average proof depth is higher for incorrect answers than for correct answers.
* Llama 2 13B has the highest average proof depth for both correct and incorrect answers compared to the other two models.
* Llama 2 7B has the lowest average proof depth for correct answers.
### Interpretation
The data suggests that a higher proof depth does not necessarily correlate with a correct answer. In fact, for all models tested, incorrect answers tend to have a higher average proof depth. This could indicate that the models are spending more computational effort on incorrect answers, or that the complexity of the problem is higher when the model fails to produce a correct answer. Llama 2 13B consistently exhibits the highest proof depth, suggesting a potentially different approach or architecture compared to the other models. The difference in proof depth between correct and incorrect answers is relatively small, but the consistent trend across all models is notable.