\n
## Bar Chart: E-CARE: Avg. Proof Depth
### Overview
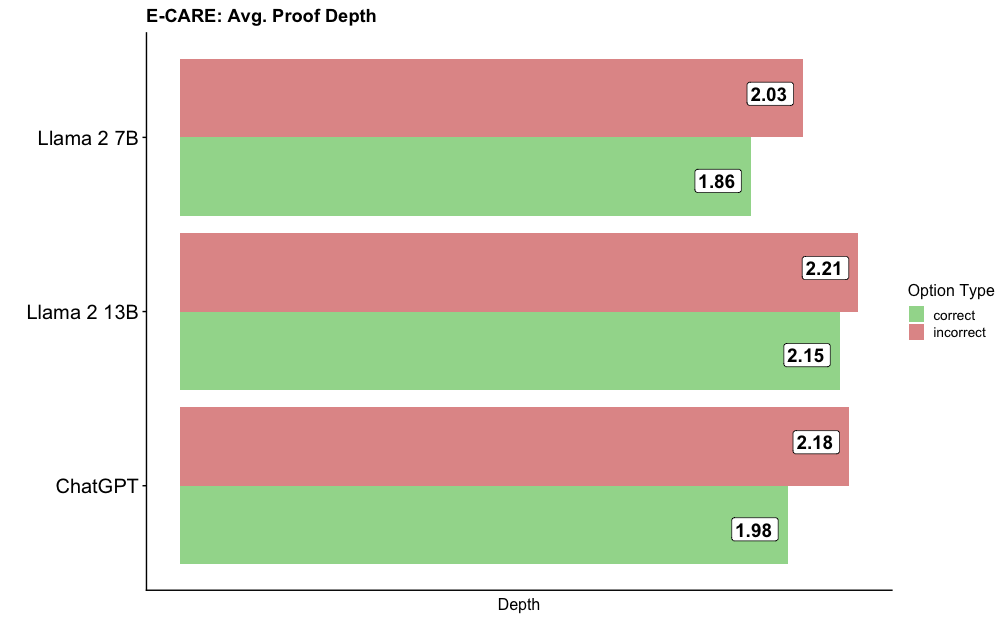
This is a horizontal bar chart comparing the average proof depth for three different language models: Llama 2 7B, Llama 2 13B, and ChatGPT. For each model, two bars are displayed, representing the average proof depth for correct and incorrect options. The chart aims to visualize how the models perform in terms of proof depth depending on the correctness of the answer.
### Components/Axes
* **Title:** E-CARE: Avg. Proof Depth (located at the top-center)
* **X-axis:** Depth (labeled at the bottom-center) - The scale is not explicitly shown, but values range from approximately 1.8 to 2.2.
* **Y-axis:** Model Names (listed vertically on the left):
* Llama 2 7B
* Llama 2 13B
* ChatGPT
* **Legend:** Located in the top-right corner.
* "correct" - represented by the color green.
* "incorrect" - represented by the color red.
### Detailed Analysis
The chart displays two bars for each model, one green (correct) and one red (incorrect).
* **Llama 2 7B:**
* Correct: The green bar extends to approximately 1.86.
* Incorrect: The red bar extends to approximately 2.03.
* **Llama 2 13B:**
* Correct: The green bar extends to approximately 2.15.
* Incorrect: The red bar extends to approximately 2.21.
* **ChatGPT:**
* Correct: The green bar extends to approximately 1.98.
* Incorrect: The red bar extends to approximately 2.18.
The bars are arranged vertically, with Llama 2 7B at the top and ChatGPT at the bottom. For each model, the red bar (incorrect) is positioned to the right of the green bar (correct).
### Key Observations
* For all three models, the average proof depth is higher for incorrect options than for correct options.
* Llama 2 13B has the highest average proof depth for both correct and incorrect options.
* Llama 2 7B has the lowest average proof depth for both correct and incorrect options.
* The difference between the correct and incorrect proof depths is relatively consistent across all three models, ranging from approximately 0.17 to 0.23.
### Interpretation
The data suggests that when language models make incorrect predictions, they tend to generate longer or more complex "proofs" compared to when they make correct predictions. This could indicate that the models are attempting to justify incorrect answers with more elaborate reasoning, or that the incorrect answers require more steps to reach. The higher average proof depth for Llama 2 13B might suggest that larger models are more prone to generating longer proofs, regardless of correctness. The consistent difference between correct and incorrect proof depths across all models suggests a systematic pattern in their reasoning process. It's important to note that "proof depth" is a metric specific to the E-CARE evaluation, and its precise meaning would require further context about the evaluation setup. The chart does not provide information about the *quality* of the proofs, only their length or complexity.