TECHNICAL ASSET FINGERPRINT
7fc046af6df1d03d43e274cc
Click to view fullscreen
Press ESC or click to close
FOUND IN PAPERS
EXPERT: healer-alpha-free VERSION 1
RUNTIME: free/openrouter/healer-alpha
INTEL_VERIFIED
## Technical Diagram: Circuit Schematic, Conceptual Model, and Voltage Transfer Characteristics
### Overview
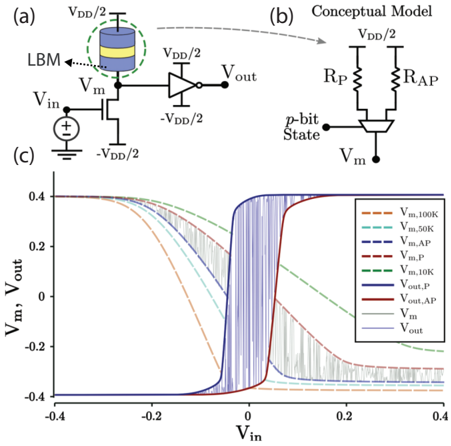
The image is a composite technical figure containing three distinct but related parts: (a) a circuit schematic, (b) a conceptual model, and (c) a voltage transfer characteristic graph. The figure illustrates the behavior of a circuit involving a "LBM" (likely a Layered Binary Memristor or similar device) and its modeling.
### Components/Axes
**Part (a): Circuit Schematic**
* **Components:**
* A voltage source labeled `Vin`.
* An n-type transistor (MOSFET) with its gate connected to `Vin`.
* A device labeled `LBM` (circled with a dashed green line) connected between the transistor's drain and a node labeled `Vm`.
* A voltage supply labeled `VDD/2` connected to the top of the LBM.
* A voltage supply labeled `-VDD/2` connected to the source of the transistor.
* An inverter (NOT gate) with its input connected to node `Vm` and its output labeled `Vout`.
* The inverter is powered by `VDD/2` and `-VDD/2`.
* **Signal Flow:** `Vin` controls the transistor, which modulates the current through the LBM, affecting the voltage at node `Vm`. `Vm` is then inverted to produce `Vout`.
**Part (b): Conceptual Model**
* **Components:**
* A circuit diagram labeled "Conceptual Model".
* Two resistors in parallel: `RP` (top) and `RAP` (bottom).
* A switch controlled by a signal labeled `p-bit State`.
* The switch connects the node between the resistors to a terminal labeled `Vm`.
* The top of the resistor network is connected to `VDD/2`.
* **Function:** This model abstracts the LBM's behavior. The `p-bit State` selects between two resistance states (`RP` and `RAP`), which sets the voltage at `Vm`.
**Part (c): Voltage Transfer Characteristic Graph**
* **Axes:**
* **X-axis:** Labeled `Vin`. Scale ranges from -0.4 to 0.4. Major tick marks at -0.4, -0.2, 0, 0.2, 0.4.
* **Y-axis:** Labeled `Vm, Vout`. Scale ranges from -0.4 to 0.4. Major tick marks at -0.4, -0.2, 0, 0.2, 0.4.
* **Legend:** Located in the top-right quadrant of the graph. Contains 9 entries:
1. `Vm,100K` (dashed orange line)
2. `Vm,50K` (dashed cyan line)
3. `Vm,AP` (dashed blue line)
4. `Vm,P` (dashed red line)
5. `Vm,10K` (dashed green line)
6. `Vout,AP` (solid red line)
7. `Vout,P` (solid blue line)
8. `Vm` (solid gray line)
9. `Vout` (solid light blue line)
### Detailed Analysis
**Graph Data Series and Trends:**
The graph plots the relationship between input voltage (`Vin`) and two output voltages (`Vm` and `Vout`) under different conditions.
1. **`Vm` Curves (Dashed Lines):** These show the voltage at node `Vm` as a function of `Vin` for different fixed resistance states of the LBM.
* **Trend:** All `Vm` curves are sigmoidal (S-shaped), transitioning from a high value (~0.4V) at negative `Vin` to a low value (~-0.4V) at positive `Vin`. The steepness of the transition varies.
* **Data Points (Approximate):**
* `Vm,100K` (Orange): Transition is the most gradual. Crosses 0V at approximately `Vin = 0.05V`.
* `Vm,50K` (Cyan): Slightly steeper than 100K. Crosses 0V at approximately `Vin = 0.02V`.
* `Vm,AP` (Blue): Steeper transition. Crosses 0V at approximately `Vin = -0.01V`.
* `Vm,P` (Red): Very steep transition. Crosses 0V at approximately `Vin = -0.05V`.
* `Vm,10K` (Green): Transition is the steepest among the dashed lines. Crosses 0V at approximately `Vin = -0.08V`.
2. **`Vout` Curves (Solid Lines):** These show the output of the inverter, which is the logical NOT of `Vm`.
* **Trend:** The `Vout` curves are also sigmoidal but inverted relative to their corresponding `Vm` curves. They transition from a low value (~-0.4V) at negative `Vin` to a high value (~0.4V) at positive `Vin`.
* **Data Points (Approximate):**
* `Vout,AP` (Solid Red): Corresponds to the `Vm,AP` state. Its transition is centered near `Vin = 0V`. It shows a sharp, almost vertical transition.
* `Vout,P` (Solid Blue): Corresponds to the `Vm,P` state. Its transition is also very sharp and centered near `Vin = 0V`, but appears slightly offset from the `Vout,AP` curve.
3. **Dynamic `Vm` and `Vout` (Solid Gray and Light Blue Lines):**
* **`Vm` (Gray):** This line exhibits significant noise or oscillation, particularly in the transition region between `Vin = -0.1V` and `Vin = 0.1V`. It appears to be a composite or measured signal that switches between the different `Vm` states.
* **`Vout` (Light Blue):** This line is a clean, sharp digital output that switches between approximately -0.4V and +0.4V. Its transition is extremely abrupt, occurring near `Vin = 0V`. It closely follows the `Vout,P` (solid blue) curve in the high state and the `Vout,AP` (solid red) curve in the low state.
### Key Observations
1. **Hysteresis and State Dependence:** The multiple `Vm` curves indicate the circuit's output depends on the internal state (resistance) of the LBM device. The system exhibits hysteresis.
2. **Sharp Digital Switching:** The final `Vout` signal (light blue) is a clean digital output with a very sharp transition, demonstrating the circuit's function as a comparator or thresholding element.
3. **Noise in Intermediate State:** The noisy `Vm` signal (gray) suggests the device may be in a metastable or switching state within the transition window, rapidly toggling between the `AP` and `P` states.
4. **Model Correspondence:** The conceptual model in (b) explains the discrete `Vm` levels seen in (c). The `p-bit State` selects between `RP` and `RAP`, creating the different `Vm` vs. `Vin` curves.
### Interpretation
This figure demonstrates the operation of a circuit designed for probabilistic or neuromorphic computing, likely using a memristive device (LBM). The core function is to convert an analog input voltage (`Vin`) into a digital output voltage (`Vout`) whose switching threshold is controlled by the internal state of the LBM.
* **What the data suggests:** The circuit acts as a state-dependent inverter. The LBM's resistance state (`AP` or `P`, corresponding to `RAP` or `RP`) sets the trip point of the inverter. The noisy `Vm` trace indicates that when the input voltage is near the threshold, the device can stochastically switch between states, which is a key feature for implementing probabilistic bits (p-bits).
* **How elements relate:** The schematic (a) is the physical implementation. The conceptual model (b) simplifies it to two resistors and a switch, explaining the discrete `Vm` curves. The graph (c) validates this model, showing the distinct `Vm` curves for each state and the resulting clean digital `Vout`. The noise in the gray `Vm` line is the empirical evidence of the stochastic switching behavior that the model aims to capture.
* **Notable Anomalies/Trends:** The most significant trend is the relationship between the steepness of the `Vm` curve and its associated resistance label. Lower resistance values (e.g., 10K) correspond to steeper transitions, implying a higher gain or sensitivity in that state. The perfect alignment of the final `Vout` (light blue) with the `Vout,P` and `Vout,AP` curves confirms the digital output is a direct, clean inversion of the selected analog state voltage.
DECODING INTELLIGENCE...