## Diagram: DPO vs Step-DPO Preference Optimization
### Overview
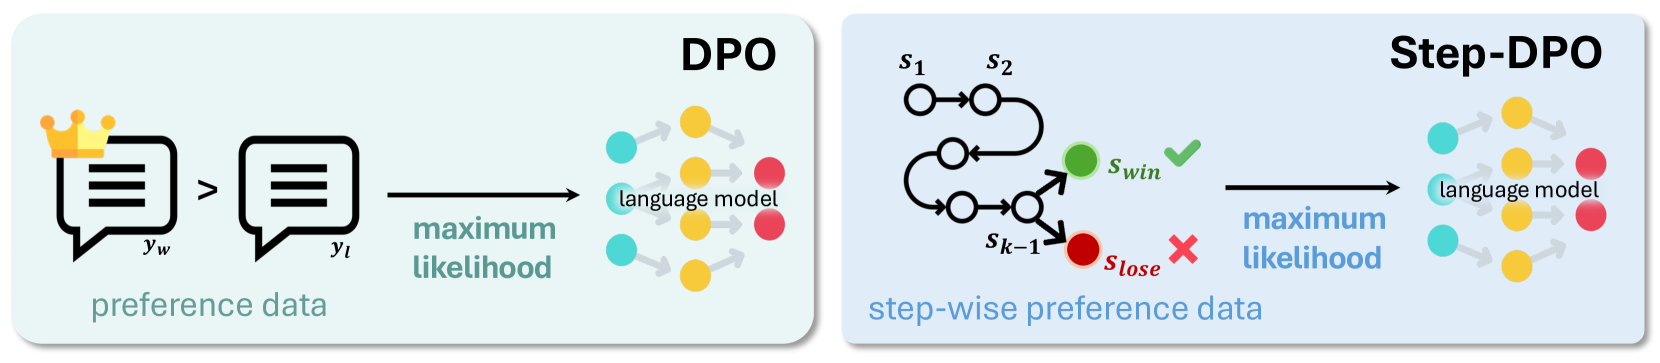
The image compares two optimization frameworks for language models: **DPO** (Direct Preference Optimization) and **Step-DPO** (Step-wise Preference Optimization). Both use preference data to train language models but differ in their approach to processing preferences.
---
### Components/Axes
#### DPO Section (Left)
- **Input**:
- Two speech bubbles labeled `y_w` (with a crown icon) and `y_t`, connected by `>` (indicating preference: `y_w > y_t`).
- Text: "preference data" below the speech bubbles.
- **Output**:
- Arrow labeled "maximum likelihood" pointing to a language model diagram.
- Language model represented by interconnected nodes:
- **Colors**: Yellow (positive), Red (negative), Blue (neutral).
- **Placement**: Right-aligned, with arrows indicating influence between nodes.
#### Step-DPO Section (Right)
- **Input**:
- Sequential states labeled `S₁` → `S₂` (top path) and `S₁` → `S_{k-1}` → `S_{lose}` (bottom path).
- Green checkmark (`✓`) on `S_win` (success state), red cross (`✗`) on `S_lose` (failure state).
- Text: "step-wise preference data" below the states.
- **Output**:
- Arrow labeled "maximum likelihood" pointing to the same language model diagram as in DPO.
- Language model nodes retain the same color scheme (yellow, red, blue).
---
### Detailed Analysis
#### DPO Workflow
1. **Preference Data**: A single preference pair (`y_w > y_t`) is used as input.
2. **Optimization**: The preference data is optimized for "maximum likelihood," directly influencing the language model.
3. **Language Model**:
- Nodes are colored yellow (likely high-confidence/positive), red (low-confidence/negative), and blue (neutral/unknown).
- Arrows suggest iterative refinement of node states based on preferences.
#### Step-DPO Workflow
1. **Step-wise Preferences**:
- States `S₁` and `S₂` represent sequential steps in a process.
- `S_win` (green) and `S_lose` (red) indicate terminal outcomes of the sequence.
2. **Optimization**:
- The stepwise preferences are optimized for "maximum likelihood," similar to DPO.
- The language model integrates these stepwise outcomes, refining node states accordingly.
---
### Key Observations
1. **Shared Language Model**: Both frameworks use identical node colors (yellow, red, blue) and connectivity, suggesting a common underlying model architecture.
2. **Preference Handling**:
- DPO uses a single preference pair (`y_w > y_t`).
- Step-DPO uses a sequence of states (`S₁ → S₂` or `S₁ → S_{k-1} → S_{lose}`) to model preferences.
3. **Outcome Indicators**:
- `S_win` (green checkmark) and `S_lose` (red cross) explicitly mark success/failure states in Step-DPO.
4. **Flow Direction**:
- DPO follows a linear flow from preference data to the language model.
- Step-DPO introduces branching paths and intermediate states before reaching the language model.
---
### Interpretation
1. **DPO vs. Step-DPO**:
- **DPO** simplifies preference optimization by directly using pairwise comparisons (`y_w > y_t`), likely for efficiency.
- **Step-DPO** models preferences as sequential processes (e.g., `S₁ → S₂`), which may better capture complex, multi-step decision-making but requires more computational steps.
2. **Language Model Role**:
- The shared language model acts as a unifying component, integrating preferences (direct or stepwise) to refine its internal states (nodes).
- Color-coded nodes (yellow/red/blue) likely represent confidence levels or activation states, adjusted during training.
3. **Practical Implications**:
- DPO may be preferable for scenarios with limited preference data.
- Step-DPO could outperform in tasks requiring nuanced, multi-step reasoning (e.g., dialogue systems, code generation).
---
### Notes
- No numerical values or quantitative data are present; the diagram focuses on architectural and procedural differences.
- The crown icon on `y_w` may symbolize a "gold standard" or high-priority preference in DPO.