## Diagram: Comparison of DPO and Step-DPO Methodologies
### Overview
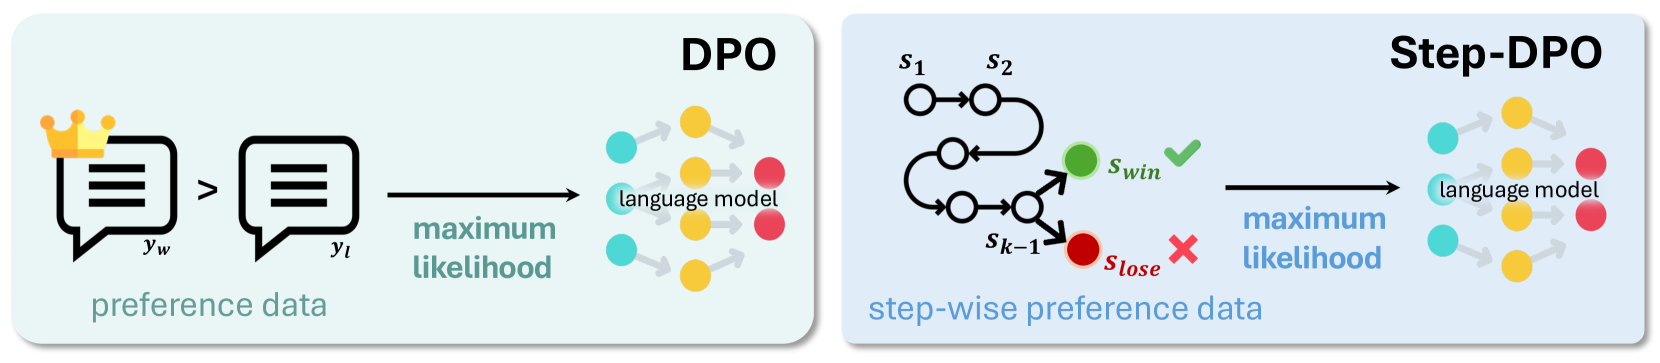
The image is a technical diagram comparing two machine learning alignment techniques: **DPO** (Direct Preference Optimization) and **Step-DPO**. It visually contrasts their data structures and training processes using a side-by-side panel layout. The left panel illustrates the standard DPO approach, while the right panel illustrates the proposed Step-DPO variant.
### Components/Axes
The diagram is divided into two distinct, rounded rectangular panels with light background colors.
**Left Panel (DPO):**
* **Title:** "DPO" (top-right corner).
* **Input Data:** Labeled "preference data" (bottom-left). It consists of two speech bubble icons.
* The left bubble is labeled `y_w` and is adorned with a golden crown, indicating the "winning" or preferred response.
* The right bubble is labeled `y_l`, indicating the "losing" or less preferred response.
* A "greater than" symbol (`>`) is placed between them, signifying the preference order: `y_w > y_l`.
* **Process Arrow:** A black arrow points from the data to the model. The text "maximum likelihood" is written below this arrow in a teal color.
* **Output Model:** Labeled "language model" (center-right). It is represented by a network diagram of interconnected nodes in teal, yellow, and red.
**Right Panel (Step-DPO):**
* **Title:** "Step-DPO" (top-right corner).
* **Input Data:** Labeled "step-wise preference data" (bottom-left). It consists of a directed graph representing a sequence of reasoning or generation steps.
* The sequence starts with nodes labeled `s₁` and `s₂`.
* The path continues through several unlabeled intermediate nodes (circles).
* The sequence culminates in a branching point from node `s_{k-1}`.
* The upper branch leads to a green node labeled `s_win` with a green checkmark (✓).
* The lower branch leads to a red node labeled `s_lose` with a red cross (✗).
* **Process Arrow:** A black arrow points from the data to the model. The text "maximum likelihood" is written below this arrow in a blue color.
* **Output Model:** Labeled "language model" (center-right). It is represented by an identical network diagram of interconnected nodes in teal, yellow, and red.
### Detailed Analysis
The diagram contrasts the fundamental data unit used for training in each method.
1. **DPO Data Flow:**
* **Trend/Flow:** The process is linear and holistic. It takes a pair of complete, final responses (`y_w`, `y_l`) and directly optimizes the language model to prefer the winning response over the losing one using a maximum likelihood objective.
* **Spatial Grounding:** The preference data (`y_w`, `y_l`) is positioned on the far left. The "maximum likelihood" label is centered below the arrow connecting the data to the model on the right.
2. **Step-DPO Data Flow:**
* **Trend/Flow:** The process is sequential and granular. It operates on the intermediate steps (`s₁`, `s₂`, ..., `s_{k-1}`) that lead to a final outcome. The preference is defined not between final outputs, but between two possible *next steps* (`s_win` vs. `s_lose`) from a given state (`s_{k-1}`). The model is trained to maximize the likelihood of the step (`s_win`) that leads to a successful outcome.
* **Spatial Grounding:** The step-wise graph is positioned on the left. The "maximum likelihood" label is centered below the arrow connecting this graph to the model on the right. The `s_win` (green) node is placed above the `s_lose` (red) node at the branch point.
### Key Observations
* **Granularity of Feedback:** The core difference is the granularity of the preference signal. DPO uses a coarse, end-of-sequence signal (which entire response is better). Step-DPO uses a fine-grained, step-level signal (which specific next step is better).
* **Visual Metaphors:** The use of a crown for `y_w` versus check/cross marks for `s_win`/`s_lose` reinforces the concept of a "winner" in DPO versus "correct/incorrect" steps in Step-DPO.
* **Model Representation:** The identical "language model" node diagram in both panels emphasizes that the underlying model architecture being trained is the same; only the training data and objective differ.
* **Color Consistency:** The "maximum likelihood" text uses a different color in each panel (teal for DPO, blue for Step-DPO), possibly to visually distinguish the two processes despite the shared objective name.
### Interpretation
This diagram serves as a conceptual explanation for why Step-DPO might be an improvement over standard DPO for complex reasoning tasks.
* **What the Data Suggests:** It suggests that for tasks requiring multi-step reasoning (e.g., math, coding, logical deduction), providing feedback on intermediate steps (`Step-DPO`) is more informative and potentially more effective than providing feedback only on the final output (`DPO`). The model learns not just what a good final answer looks like, but *how to get there* step-by-step.
* **Relationship Between Elements:** The left panel establishes the baseline (DPO). The right panel introduces a modification: inserting a structured, step-wise reasoning graph between the raw preference data and the model training objective. This implies that Step-DPO is an extension or specialization of the DPO framework.
* **Underlying Message:** The diagram argues that aligning models on the *process* of reasoning (Step-DPO) is a more precise and potentially powerful method than aligning them solely on the *product* of reasoning (DPO). It visually advocates for the value of step-level supervision in training language models for complex tasks.