## Line Chart: MLNN Training: L_contradiction and A_θ vs. Epoch
### Overview
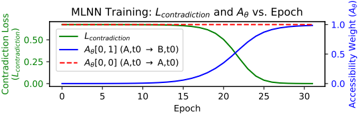
The image is a line chart illustrating the performance of an MLNN (Multi-Layer Neural Network) during training. It plots the Contradiction Loss (L_contradiction) and Accessibility Weight (A_θ) against the training Epoch. There are two y-axes, one for Contradiction Loss on the left and one for Accessibility Weight on the right. The x-axis represents the Epoch number.
### Components/Axes
* **Title:** MLNN Training: L_contradiction and A_θ vs. Epoch
* **X-axis:**
* Label: Epoch
* Scale: 0 to 30, with tick marks at intervals of 5 (0, 5, 10, 15, 20, 25, 30)
* **Left Y-axis:**
* Label: Contradiction Loss (L_contradiction)
* Scale: 0.00 to 0.50, with tick marks at intervals of 0.25 (0.00, 0.25, 0.50)
* **Right Y-axis:**
* Label: Accessibility Weight (A_θ)
* Scale: 0.0 to 1.0, with tick marks at intervals of 0.5 (0.0, 0.5, 1.0)
* **Legend:** Located in the top-center of the chart.
* Green Line: L_contradiction
* Blue Line: A_θ[0, 1] (A,t0 → B,t0)
* Red Dashed Line: A_θ[0, 0] (A,t0 → A,t0)
### Detailed Analysis
* **L_contradiction (Green Line):**
* Trend: Decreases from approximately 0.6 to 0.0 as Epoch increases.
* Data Points: Starts at approximately 0.6 at Epoch 0, decreases gradually until Epoch 15, then decreases more rapidly between Epoch 15 and Epoch 25, and finally plateaus near 0.0 after Epoch 25.
* **A_θ[0, 1] (A,t0 → B,t0) (Blue Line):**
* Trend: Increases from approximately 0.0 to 1.0 as Epoch increases.
* Data Points: Starts at approximately 0.0 at Epoch 0, remains near 0.0 until Epoch 15, then increases rapidly between Epoch 15 and Epoch 25, and finally plateaus near 1.0 after Epoch 25.
* **A_θ[0, 0] (A,t0 → A,t0) (Red Dashed Line):**
* Trend: Remains constant at approximately 1.0 across all Epochs.
* Data Points: Stays at approximately 1.0 from Epoch 0 to Epoch 30.
### Key Observations
* The Contradiction Loss (L_contradiction) decreases as the Accessibility Weight for the transition from state A to state B (A_θ[0, 1]) increases.
* The Accessibility Weight for the transition from state A to state A (A_θ[0, 0]) remains constant at 1.0 throughout the training process.
* The most significant changes in L_contradiction and A_θ[0, 1] occur between Epoch 15 and Epoch 25.
### Interpretation
The chart illustrates the training dynamics of an MLNN, showing how the model learns to reduce contradiction and adjust accessibility weights over time. The decrease in L_contradiction suggests that the model is becoming more consistent in its predictions. The increase in A_θ[0, 1] indicates that the model is learning to favor the transition from state A to state B, while A_θ[0, 0] remaining at 1.0 suggests that the model consistently maintains the accessibility of state A to itself. The convergence of L_contradiction towards 0 and A_θ[0, 1] towards 1 after Epoch 25 indicates that the model has largely converged and further training may yield diminishing returns.