## Diagram: LLM Uncertainty Estimation
### Overview
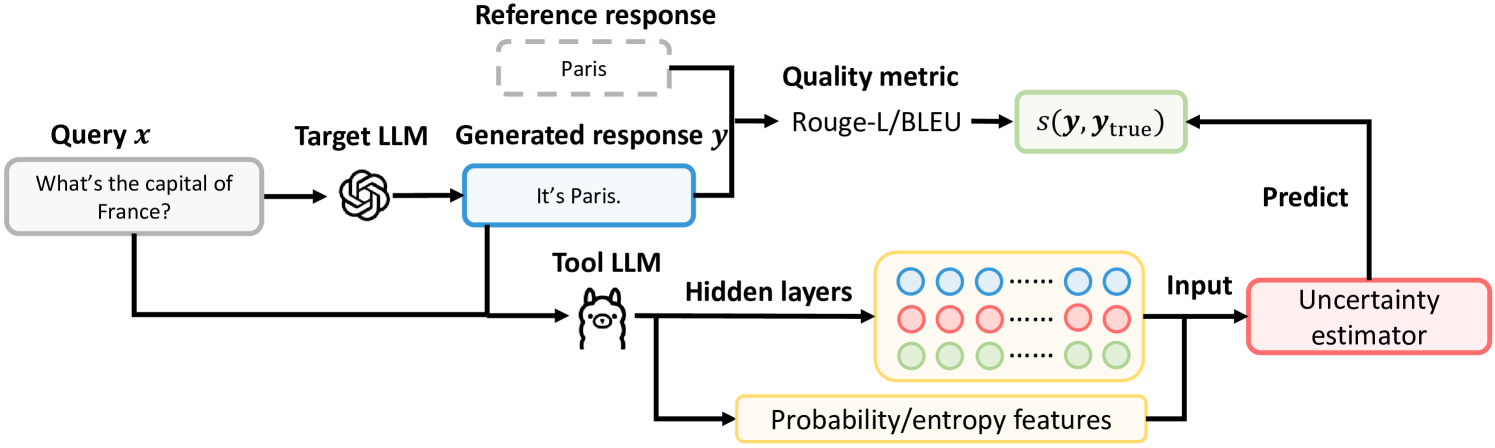
The image is a diagram illustrating a system for estimating the uncertainty of a Target Large Language Model (LLM) response. It shows the flow of information from a query, through the Target LLM, and then through a series of steps involving a Tool LLM, quality metrics, and an uncertainty estimator.
### Components/Axes
* **Query x:** A gray rounded rectangle containing the question "What's the capital of France?".
* **Target LLM:** A stylized icon representing a language model.
* **Generated response y:** A blue rounded rectangle containing the answer "It's Paris.".
* **Reference response:** A dashed gray rounded rectangle containing the answer "Paris".
* **Quality metric:** Labeled "Rouge-L/BLEU".
* **s(y, ytrue):** A green rounded rectangle representing the score of the generated response compared to the true response.
* **Tool LLM:** A cartoon llama icon representing a language model.
* **Hidden layers:** A yellow rounded rectangle containing three rows of circles, colored blue, red, and green.
* **Probability/entropy features:** A yellow rounded rectangle.
* **Uncertainty estimator:** A red rounded rectangle.
* **Predict:** A label indicating the prediction step.
### Detailed Analysis or Content Details
1. **Query Input:** The process begins with a query "What's the capital of France?" which is fed into the Target LLM.
2. **Target LLM Response:** The Target LLM generates a response, "It's Paris.".
3. **Quality Assessment:** The generated response is compared to a reference response ("Paris") using quality metrics like Rouge-L/BLEU, resulting in a score s(y, ytrue).
4. **Tool LLM and Feature Extraction:** The query and the generated response are also fed into a Tool LLM. The Tool LLM extracts probability/entropy features from its hidden layers.
5. **Uncertainty Estimation:** The quality score s(y, ytrue) and the probability/entropy features are used as input to an Uncertainty Estimator.
6. **Prediction:** The Uncertainty Estimator predicts the uncertainty associated with the Target LLM's response.
### Key Observations
* The diagram illustrates a closed-loop system where the uncertainty estimation is based on both the quality of the response and the internal features of a Tool LLM.
* The use of a separate Tool LLM suggests that it provides additional information or features that are not directly available from the Target LLM.
* The quality metric (Rouge-L/BLEU) compares the generated response to a reference response, which is assumed to be the ground truth.
### Interpretation
The diagram presents a method for quantifying the uncertainty of a language model's response. By combining traditional quality metrics with features extracted from a separate Tool LLM, the system aims to provide a more comprehensive assessment of the reliability of the generated output. This approach could be valuable in applications where it is crucial to know how confident the model is in its answer, such as in safety-critical systems or when providing information to users who need to make informed decisions. The system leverages the strengths of both explicit quality measures (Rouge-L/BLEU) and implicit features learned by a neural network (Tool LLM), potentially leading to a more robust and accurate uncertainty estimation.