\n
## Diagram: LLM Quality Estimation Pipeline
### Overview
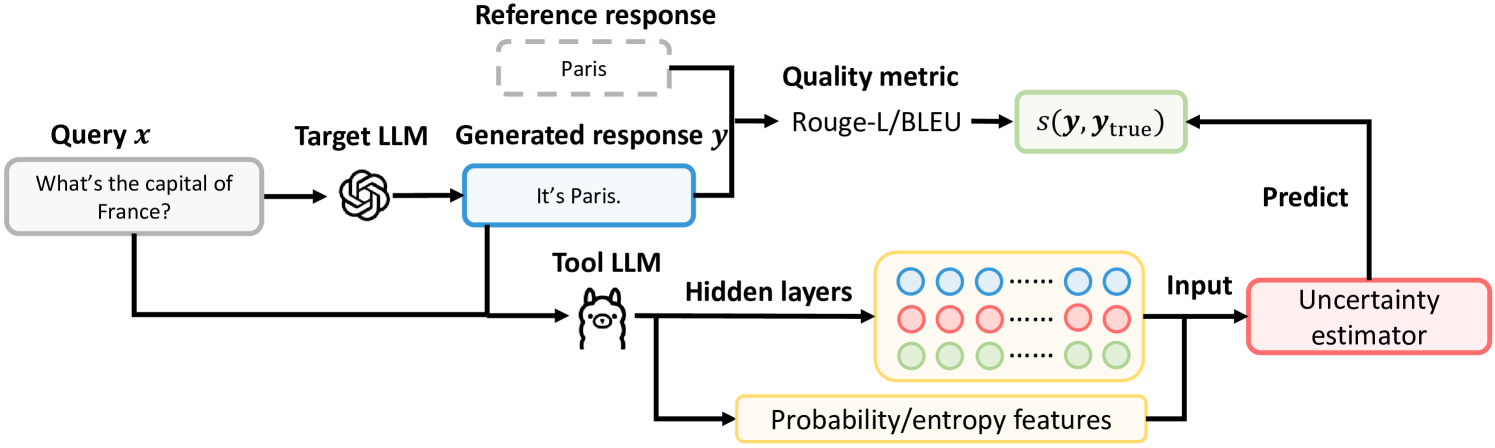
This diagram illustrates a pipeline for estimating the quality of responses generated by a Large Language Model (LLM). The pipeline takes a query as input, generates a response using a target LLM, compares the generated response to a reference response using a quality metric, and then uses a tool LLM and uncertainty estimator to predict the quality.
### Components/Axes
The diagram consists of the following components:
* **Query x:** Input question: "What's the capital of France?"
* **Target LLM:** Represented by a spiral graphic.
* **Generated response y:** Output of the Target LLM: "It's Paris."
* **Reference response:** "Paris" enclosed in a dashed rectangle.
* **Quality metric:** "Rouge-L/BLEU" which calculates s(y, y_true).
* **Tool LLM:** Represented by a graphic of a robot head.
* **Hidden layers:** Represented by three rows of circles (blue, red, and yellow).
* **Probability/entropy features:** Output of the Tool LLM.
* **Input:** Input to the Uncertainty estimator.
* **Uncertainty estimator:** A rectangular block labeled "Uncertainty estimator".
* **Predict:** Output of the Uncertainty estimator, feeding back into the Quality metric.
Arrows indicate the flow of information between these components.
### Detailed Analysis or Content Details
The diagram shows a sequential process:
1. A query "What's the capital of France?" (Query x) is input to the Target LLM.
2. The Target LLM generates the response "It's Paris." (Generated response y).
3. The generated response is compared to the reference response "Paris" using the quality metric "Rouge-L/BLEU", resulting in a score s(y, y_true).
4. The query is also input to the Tool LLM.
5. The Tool LLM processes the query through hidden layers (three rows of circles: blue, red, and yellow).
6. The Tool LLM outputs probability/entropy features.
7. These features are used as input to the Uncertainty estimator.
8. The Uncertainty estimator predicts a value, which is then fed back into the Quality metric.
### Key Observations
The diagram highlights a closed-loop system where the uncertainty estimation influences the quality assessment. The use of both a target LLM and a tool LLM suggests a multi-faceted approach to quality evaluation. The hidden layers within the Tool LLM indicate a complex internal processing mechanism.
### Interpretation
This diagram represents a sophisticated approach to evaluating the quality of LLM-generated responses. It goes beyond simple metric comparison (Rouge-L/BLEU) by incorporating an uncertainty estimator, which likely aims to capture the confidence or reliability of the generated response. The Tool LLM, with its hidden layers, likely extracts features from the query that are relevant to quality assessment. The feedback loop suggests that the uncertainty estimation can refine the quality metric, potentially leading to a more accurate and nuanced evaluation. The diagram suggests a focus on not just *what* the LLM says, but *how confident* it is in its response. This is particularly important in applications where reliability is critical. The use of probability/entropy features suggests the system is attempting to quantify the LLM's internal state and use that information to improve quality assessment.