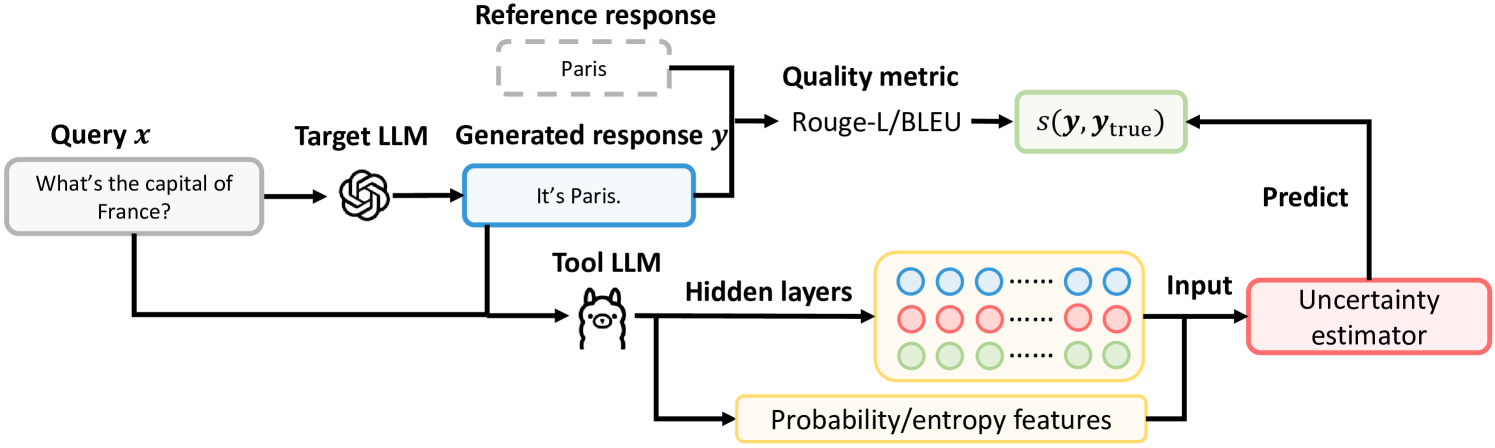
## Flowchart: Response Generation and Quality Evaluation System
### Overview
The flowchart illustrates a technical system for generating and evaluating responses to queries using language models (LLMs). It shows the flow from a user query through response generation, quality assessment, and uncertainty estimation. Key components include a target LLM, reference response, quality metric, hidden layers, and an uncertainty estimator.
### Components/Axes
1. **Query (x)**: Input question ("What's the capital of France?")
2. **Target LLM**: Generates response ("It's Paris.")
3. **Reference Response**: Ground truth answer ("Paris")
4. **Quality Metric**: Evaluates response using Rouge-L/BLEU scores
5. **Uncertainty Estimator**: Predicts uncertainty based on hidden layer features
6. **Tool LLM**: Processes hidden layers to extract probability/entropy features
7. **Hidden Layers**: Represented by colored circles (blue, red, green)
8. **Probability/Entropy Features**: Output from hidden layers
9. **Color Coding**:
- Blue: Target LLM/Generated response
- Red: Uncertainty estimator
- Green: Quality metric
- Yellow: Hidden layers/Probability/entropy features
### Detailed Analysis
- **Query Flow**:
- Query `x` → Target LLM → Generated response `y` ("It's Paris.")
- Reference response ("Paris") is compared to `y` via quality metric.
- **Quality Metric**:
- Outputs `s(y, y_true)` (score comparing generated vs. reference response).
- **Uncertainty Estimator**:
- Takes input from hidden layers (colored circles) to predict uncertainty.
- Hidden layers process probability/entropy features (yellow box).
- **Color Consistency**:
- Blue elements (Target LLM, Generated response) match blue circles in hidden layers.
- Red elements (Uncertainty estimator) match red circles.
- Green elements (Quality metric) match green circles.
### Key Observations
1. **Linear Workflow**: Query → Response Generation → Quality Evaluation → Uncertainty Estimation.
2. **Feedback Loop**: Reference response and quality metric likely inform improvements to the target LLM.
3. **Uncertainty Source**: Uncertainty is derived from hidden layer activity (probability/entropy), suggesting confidence assessment in the response.
4. **Missing Numerical Data**: No specific scores or values are provided for Rouge-L/BLEU or uncertainty metrics.
### Interpretation
This system demonstrates a closed-loop approach to LLM response generation and evaluation. The integration of quality metrics (Rouge-L/BLEU) ensures responses align with reference answers, while the uncertainty estimator uses internal model dynamics (hidden layers) to quantify confidence. The lack of numerical data points suggests the diagram emphasizes architectural relationships over empirical results. The use of probability/entropy features implies a focus on epistemic uncertainty (model knowledge gaps) rather than aleatoric uncertainty (data noise). The color-coded components visually separate distinct stages, aiding in understanding the system's modular design.