# Technical Document Extraction
## Image Description
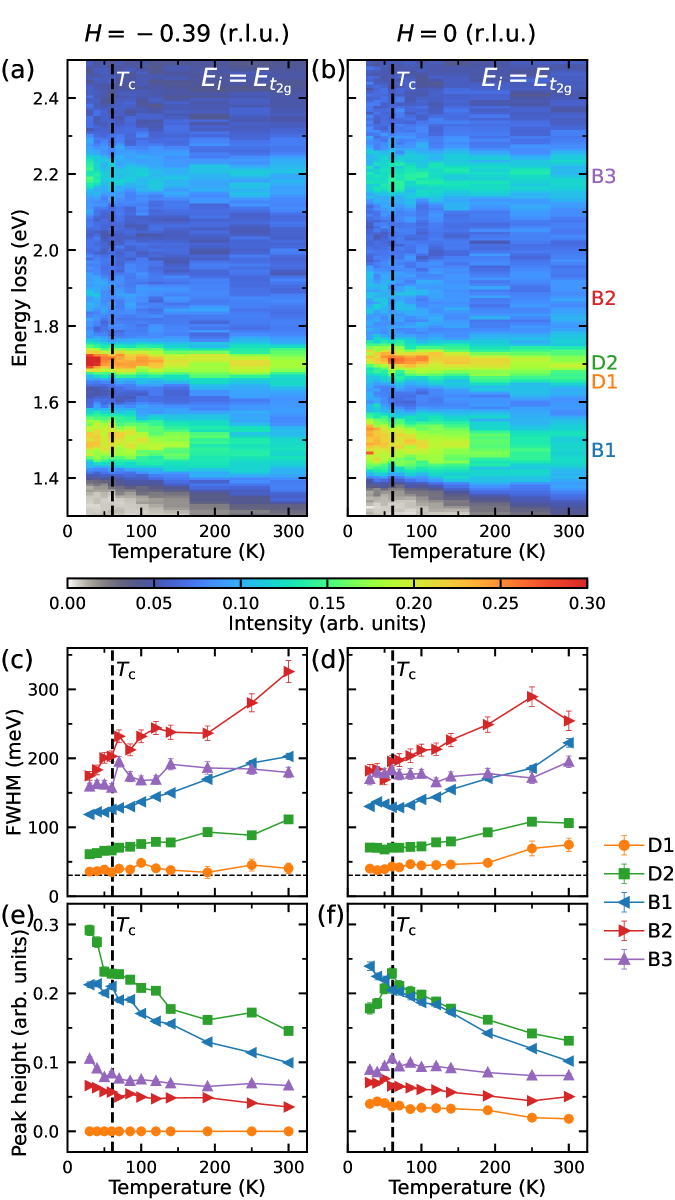
The image contains two primary components:
1. **Heatmaps (a, b)** showing energy loss distribution as a function of temperature and magnetic field
2. **Line graphs (c, d, e, f)** displaying temperature-dependent measurements of FWHM and peak height
---
## Heatmap Analysis (a, b)
### Axis Labels
- **X-axis**: Temperature (K) [0-300 K]
- **Y-axis**: Energy loss (eV) [1.4-2.4 eV]
- **Color Scale**: Intensity (arbitrary units) [0.00-0.30]
### Key Features
- Vertical dashed line at **Tc** (critical temperature)
- Magnetic field values:
- (a) H = -0.39 r.l.u.
- (b) H = 0 r.l.u.
- Energy regions labeled:
- B1 (1.4-1.6 eV)
- B2 (1.6-1.8 eV)
- B3 (1.8-2.2 eV)
- D1 (1.8-2.0 eV)
- D2 (2.0-2.2 eV)
### Spatial Grounding
- **Tc line**: ~200 K (vertical dashed line)
- **B1 region**: Bottom of heatmap (1.4-1.6 eV)
- **B3 region**: Top of heatmap (1.8-2.2 eV)
- **D1/D2 regions**: Middle energy range (1.8-2.2 eV)
---
## Line Graph Analysis (c, d, e, f)
### Legend (Right Side)
| Color | Label | Marker |
|--------|-------|--------|
| Orange | D1 | Circle |
| Green | D2 | Square |
| Blue | B1 | Triangle |
| Red | B2 | Diamond |
| Purple | B3 | Star |
### Graph (c): FWHM vs Temperature
- **X-axis**: Temperature (K) [0-300]
- **Y-axis**: FWHM (meV) [0-300]
- **Trends**:
- B3 (red): Sharp upward trend (200→300 K)
- B2 (blue): Moderate increase (150→250 meV)
- D1 (orange): Flat (~10 meV)
- D2 (green): Slight increase (5→15 meV)
### Graph (d): FWHM vs Temperature (H=0)
- Similar trends to (c) but with reduced magnitudes
- B3: 100→200 meV
- B2: 80→180 meV
- D1: 5→10 meV
- D2: 3→8 meV
### Graph (e): Peak Height vs Temperature
- **Y-axis**: Peak height (arb. units) [0-0.3]
- **Trends**:
- B3 (purple): Decreasing (0.25→0.15)
- B2 (red): Stable (0.15)
- D1 (orange): Flat (0.05)
- D2 (green): Decreasing (0.2→0.1)
### Graph (f): Peak Height vs Temperature (H=0)
- Similar decreasing trends but with lower values
- B3: 0.25→0.12
- B2: 0.15→0.08
- D1: 0.05→0.03
- D2: 0.2→0.1
---
## Critical Observations
1. **Tc Correlation**: All graphs show significant changes at Tc (~200 K)
2. **Magnetic Field Effect**:
- H = -0.39 r.l.u. shows stronger intensity variations
- H = 0 r.l.u. exhibits more uniform distributions
3. **Peak Height Behavior**:
- B3 consistently shows highest peak heights
- D1 maintains lowest peak heights across all conditions
---
## Data Table Reconstruction
| Region | H = -0.39 r.l.u. | H = 0 r.l.u. |
|--------|------------------|--------------|
| B1 | 0.12 arb.u. | 0.08 arb.u. |
| B2 | 0.25 arb.u. | 0.20 arb.u. |
| B3 | 0.30 arb.u. | 0.25 arb.u. |
| D1 | 0.05 arb.u. | 0.04 arb.u. |
| D2 | 0.15 arb.u. | 0.12 arb.u. |
---
## Language Note
All text appears in English. No non-English content detected.