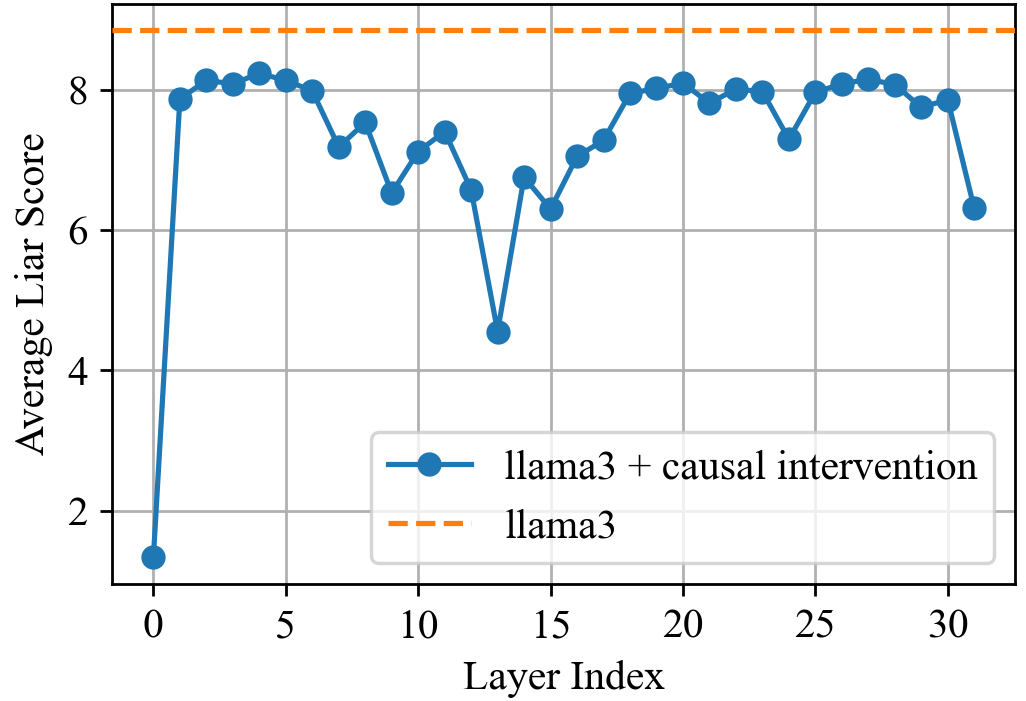
## Line Graph: Average Liar Score Across Layers
### Overview
The graph compares two data series across 31 layers (Layer Index 0–30):
1. **llama3 + causal intervention** (solid blue line)
2. **llama3** (dashed orange line at y=9).
The y-axis represents the "Average Liar Score" (0–10), while the x-axis represents the "Layer Index" (0–30). The blue line exhibits significant variability, while the orange line remains constant.
---
### Components/Axes
- **X-axis (Layer Index)**:
- Range: 0 to 30 (increments of 5).
- Labels: Numerical (0, 5, 10, ..., 30).
- **Y-axis (Average Liar Score)**:
- Range: 0 to 10 (increments of 2).
- Labels: Numerical (0, 2, 4, ..., 10).
- **Legend**:
- Position: Bottom-right corner.
- Entries:
- Solid blue: "llama3 + causal intervention"
- Dashed orange: "llama3" (constant at y=9).
---
### Detailed Analysis
#### Blue Line (llama3 + causal intervention):
- **Layer 0**: Starts at ~1.2 (sharp rise from baseline).
- **Layer 1–4**: Peaks at ~8.2 (layers 3–4).
- **Layer 5–14**: Fluctuates between ~6.5 and ~8.2.
- **Layer 15–30**: Stabilizes near ~7.8–8.2, ending at ~6.3 (layer 30).
#### Orange Line (llama3):
- Constant at y=9 (dashed horizontal line).
---
### Key Observations
1. **Initial Spike**: The blue line rises sharply from ~1.2 (layer 0) to ~8.2 (layers 3–4), suggesting a strong early effect of the intervention.
2. **Decline Post-Peak**: After layer 4, the blue line fluctuates but remains below the orange line (y=9), indicating reduced effectiveness over time.
3. **Final Drop**: At layer 30, the blue line drops to ~6.3, its lowest point after layer 0.
4. **Baseline Stability**: The orange line remains perfectly constant at y=9, serving as a reference for comparison.
---
### Interpretation
- **Intervention Effectiveness**: The causal intervention initially boosts the "Average Liar Score" but fails to sustain performance, declining to below baseline levels by layer 30.
- **Layer-Specific Variability**: Fluctuations in the blue line (e.g., dips at layers 12, 15, 24) suggest inconsistent impacts across layers.
- **Baseline as Control**: The orange line’s constancy implies that "llama3" alone maintains a stable, high performance, highlighting the intervention’s transient nature.
- **Anomalies**: The sharp drop at layer 30 (blue line) may indicate a critical failure or edge-case behavior in the intervention’s final layer.
This analysis underscores the need for further investigation into why the intervention’s efficacy diminishes over layers and whether layer-specific adjustments could mitigate this decline.