## Line Graph: Average Liar Score vs. Layer Index
### Overview
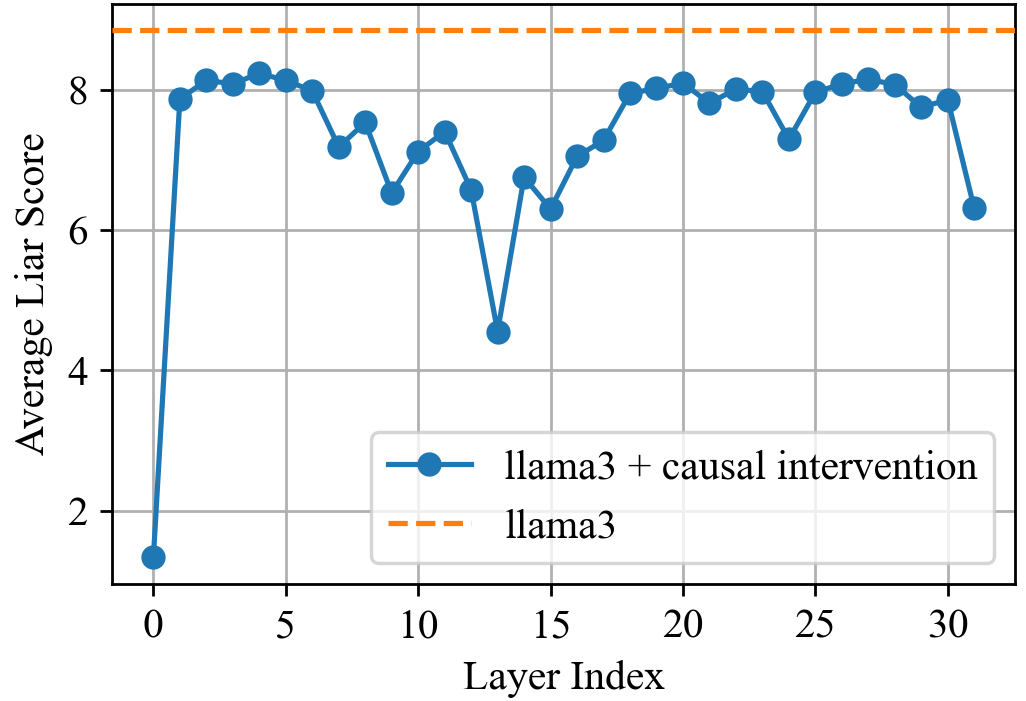
The image is a line graph comparing the "Average Liar Score" of two configurations of the "llama3" model across different "Layer Index" values. One configuration is "llama3 + causal intervention" (solid blue line with circular markers), and the other is "llama3" (dashed orange line). The graph shows how the average liar score changes as the layer index increases.
### Components/Axes
* **Y-axis:** "Average Liar Score", ranging from 0 to 8, with gridlines at each integer value.
* **X-axis:** "Layer Index", ranging from 0 to 30, with markers at intervals of 5.
* **Legend (bottom-right):**
* Solid blue line with circular markers: "llama3 + causal intervention"
* Dashed orange line: "llama3"
### Detailed Analysis
* **llama3 + causal intervention (solid blue line):**
* The line starts at approximately 1.3 at Layer Index 0.
* It rapidly increases to approximately 8.0 at Layer Index 2.
* It fluctuates between approximately 7.0 and 8.2 from Layer Index 2 to Layer Index 12.
* It dips to a minimum of approximately 4.5 at Layer Index 14.
* It recovers to approximately 8.0 at Layer Index 20.
* It fluctuates between approximately 7.8 and 8.2 from Layer Index 20 to Layer Index 30.
* It drops to approximately 6.3 at Layer Index 32.
* **llama3 (dashed orange line):**
* The line is relatively constant at approximately 8.8 across all Layer Index values.
### Key Observations
* The "llama3 + causal intervention" configuration shows significant variability in the average liar score across different layers, with a notable dip around Layer Index 14.
* The "llama3" configuration maintains a consistently high average liar score across all layers.
* The "llama3" configuration consistently has a higher average liar score than the "llama3 + causal intervention" configuration.
### Interpretation
The graph suggests that causal intervention in the "llama3" model leads to a fluctuating average liar score across different layers, with a significant drop at Layer Index 14. This indicates that the causal intervention affects the model's behavior differently at different layers. In contrast, the "llama3" model without causal intervention maintains a stable and high average liar score, suggesting a more consistent behavior across all layers. The higher average liar score for the "llama3" model without intervention could indicate a higher propensity for generating untruthful statements compared to the intervened model, at least at certain layers. The causal intervention seems to introduce variability and, at times, reduces the average liar score.