# Technical Data Extraction: Llama3 Causal Intervention Analysis
## 1. Image Overview
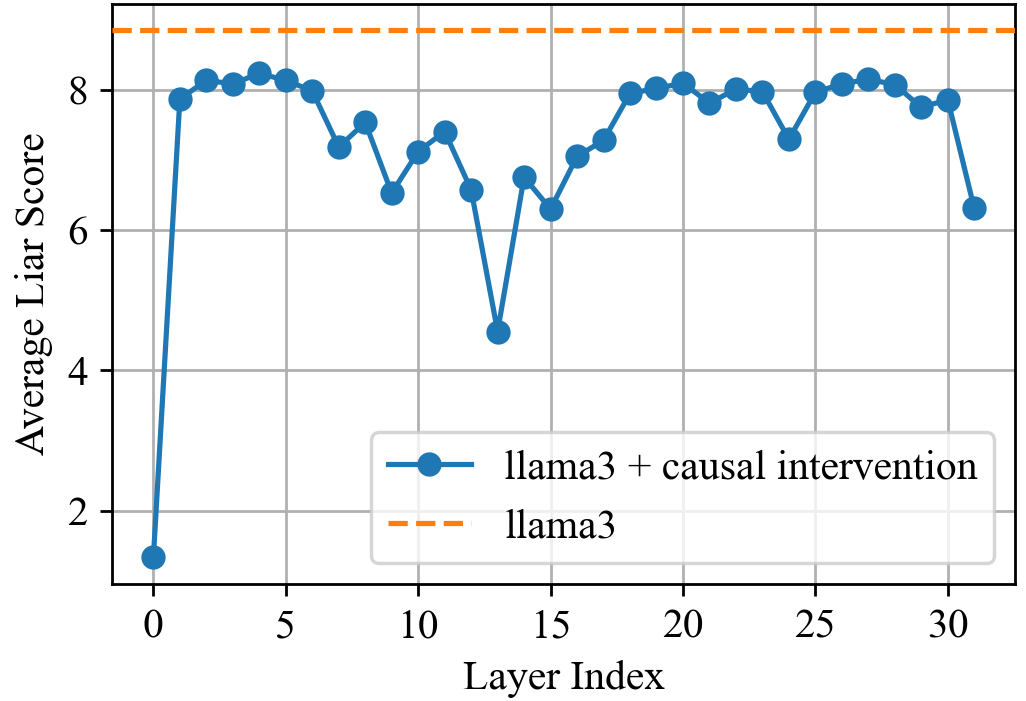
This image is a line graph illustrating the performance of a Large Language Model (LLM) across its internal layers. It compares a baseline model against a version with "causal intervention" applied.
## 2. Component Isolation
### Header/Metadata
* **Language:** English
* **Subject:** Model performance (Liar Score) per layer index.
### Main Chart Area
* **Y-Axis Label:** `Average Liar Score`
* **Y-Axis Scale:** Linear, ranging from approximately 1.0 to 9.0, with major tick marks at `2`, `4`, `6`, and `8`.
* **X-Axis Label:** `Layer Index`
* **X-Axis Scale:** Linear, ranging from `0` to `32`, with major tick marks every 5 units (`0, 5, 10, 15, 20, 25, 30`).
* **Grid:** A light gray orthogonal grid is present.
### Legend (Spatial Grounding: Bottom Right [x≈0.65, y≈0.25])
* **Series 1 (Solid Blue Line with Circular Markers):** `llama3 + causal intervention`
* **Series 2 (Dashed Orange Line):** `llama3`
---
## 3. Data Series Analysis and Trends
### Series 1: `llama3 + causal intervention`
* **Visual Trend:** The data begins at a very low point at Layer 0, followed by a sharp vertical ascent to Layer 1. From Layers 1 to 31, the score fluctuates significantly, exhibiting a "W" or "M" shaped pattern with a deep trough near the middle layers (Layer 13) and a final drop-off at the last layer.
* **Key Data Points (Estimated):**
* **Layer 0:** ~1.3 (Minimum)
* **Layer 1-5:** Rapid rise to a plateau around 8.0 - 8.2.
* **Layer 9:** Local dip to ~6.5.
* **Layer 13:** Significant global dip to ~4.5.
* **Layer 20:** Recovery to a local peak of ~8.1.
* **Layer 31:** Final value drops to ~6.3.
### Series 2: `llama3` (Baseline)
* **Visual Trend:** A horizontal dashed line that remains constant across all layer indices. This represents a static baseline for the model without intervention.
* **Key Data Point:**
* **Constant Value:** ~8.8 (This is the maximum value shown on the chart).
---
## 4. Comparative Summary
The chart demonstrates that the "causal intervention" significantly reduces the "Average Liar Score" compared to the baseline `llama3` model across every single layer.
* **Maximum Impact:** The intervention is most effective at **Layer 0** (reducing the score from ~8.8 to ~1.3) and **Layer 13** (reducing the score from ~8.8 to ~4.5).
* **Minimum Impact:** The intervention is least effective in the early layers (2-5) and late-middle layers (18-22, 26-28), where the score remains closest to the baseline, though still lower (peaking around 8.2).
* **Conclusion:** The causal intervention has a non-uniform effect across the model's architecture, with specific layers showing much higher sensitivity to the intervention than others.