\n
## Line Chart: Average Liar Score vs. Layer Index
### Overview
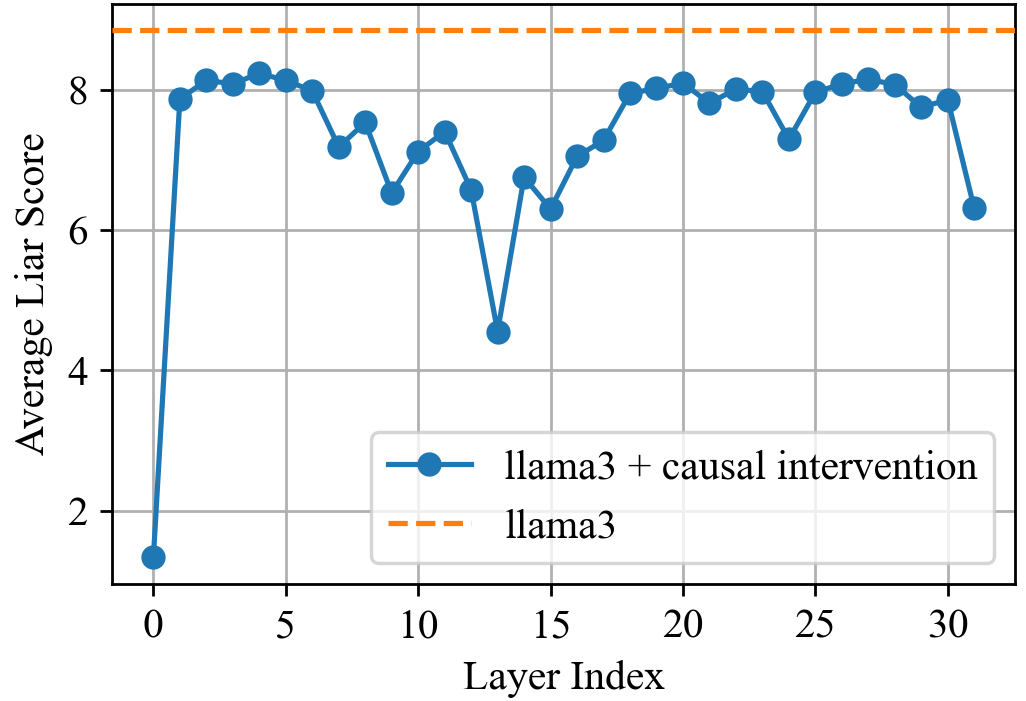
This line chart compares the average "Liar Score" of a model ("llama3 + causal intervention") against a baseline model ("llama3") across different layers of the model, indexed from 0 to 30. The chart aims to demonstrate the effect of the causal intervention on the model's liar score as the layers deepen.
### Components/Axes
* **X-axis:** "Layer Index" - Ranges from 0 to 30, with tick marks at integer values.
* **Y-axis:** "Average Liar Score" - Ranges from 0 to 9, with tick marks at integer values.
* **Data Series 1:** "llama3 + causal intervention" - Represented by a blue line with circular markers.
* **Data Series 2:** "llama3" - Represented by an orange dashed line.
* **Legend:** Located in the bottom-right corner of the chart.
### Detailed Analysis
**Data Series 1: "llama3 + causal intervention" (Blue Line)**
The blue line starts at approximately 1.2 at Layer Index 0, rapidly increasing to around 8.3 by Layer Index 2. It then exhibits a fluctuating pattern, generally remaining between 7 and 8.5.
Here's a breakdown of approximate values at specific Layer Indices:
* Layer Index 0: 1.2
* Layer Index 2: 8.3
* Layer Index 5: 8.1
* Layer Index 8: 7.2
* Layer Index 10: 5.0
* Layer Index 12: 6.4
* Layer Index 15: 7.4
* Layer Index 18: 8.2
* Layer Index 20: 8.4
* Layer Index 23: 8.1
* Layer Index 26: 7.9
* Layer Index 30: 6.8
**Data Series 2: "llama3" (Orange Dashed Line)**
The orange dashed line is a horizontal line at approximately 8.6, indicating a constant "Average Liar Score" across all Layer Indices.
### Key Observations
* The "llama3 + causal intervention" model starts with a significantly lower "Average Liar Score" than the baseline "llama3" model.
* The "llama3 + causal intervention" model's score rapidly increases in the initial layers (0-2).
* After the initial increase, the "llama3 + causal intervention" model's score fluctuates around a value close to the baseline "llama3" model's score.
* The "llama3 + causal intervention" model's score appears to slightly decrease towards the end of the layer indices (around Layer Index 30).
* The baseline "llama3" model maintains a constant "Average Liar Score" throughout all layers.
### Interpretation
The data suggests that the causal intervention initially reduces the "Liar Score" of the model, but as the layers deepen, the intervention's effect plateaus, and the score converges towards the baseline "llama3" model's score. The initial reduction could indicate that the intervention is effective in mitigating "lying" behavior in the early layers of the model. However, the convergence suggests that the intervention's impact diminishes as the model becomes more complex. The slight decrease in the "llama3 + causal intervention" score at the end could be due to the intervention having a subtle negative effect on performance in the deeper layers, or simply random fluctuation. The constant score of the baseline model indicates that it is not affected by the layer index, suggesting that its "Liar Score" is inherent to its architecture and training. Further investigation would be needed to understand why the intervention's effect diminishes with depth and whether the final decrease is statistically significant.