## Diagram: Grid with Labeled Regions
### Overview
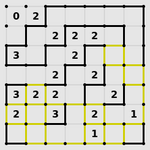
The image shows a grid, approximately 9x9, with some cells outlined in black and others in yellow. Numbers are placed within some of the outlined regions. The grid appears to represent a spatial arrangement of different zones or areas, each labeled with a numerical value.
### Components/Axes
* **Grid:** A square grid structure, approximately 9 rows and 9 columns.
* **Black Outlines:** Black lines enclose certain areas within the grid.
* **Yellow Outlines:** Yellow lines enclose other areas within the grid.
* **Numerical Labels:** Numbers (0, 1, 2, 3) are placed inside some of the outlined regions.
### Detailed Analysis
Here's a breakdown of the numerical labels and their approximate locations:
* **Top-Left:** A region in the top-left corner contains the number "0". Adjacent to it, a region contains the number "2".
* **Upper-Center:** A cluster of regions in the upper-center area are labeled with "2".
* **Left-Center:** A region in the left-center area is labeled with "3".
* **Center:** Several regions in the center are labeled with "2".
* **Bottom-Left:** Regions in the bottom-left corner are labeled with "3" and "2".
* **Bottom-Center:** Regions in the bottom-center are labeled with "3", "2", and "1".
* **Right-Center:** Regions in the right-center are labeled with "2" and "1".
### Key Observations
* The grid is divided into distinct regions, each enclosed by either black or yellow lines.
* The numerical labels seem to indicate a property or value associated with each region.
* The distribution of black and yellow outlines is not uniform, suggesting different categories or types of regions.
### Interpretation
The diagram likely represents a spatial model or map where different areas are categorized and labeled. The numbers could represent a value, a count, or an index associated with each region. The black and yellow outlines might indicate different types of zones or areas. Without further context, it's difficult to determine the exact meaning of the diagram, but it appears to be a visual representation of spatially distributed data.