## Chart Type: Pie Charts Comparing Datasets
### Overview
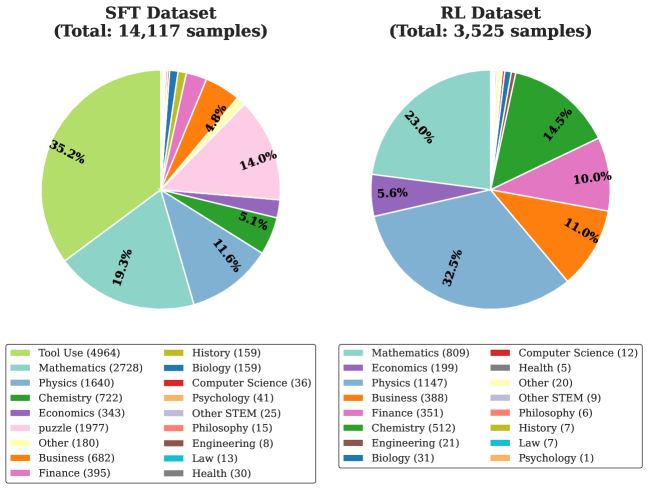
The image presents two pie charts side-by-side, comparing the distribution of samples across different categories in two datasets: "SFT Dataset" and "RL Dataset." The SFT Dataset contains a total of 14,117 samples, while the RL Dataset contains 3,525 samples. Each slice of the pie charts represents a category (e.g., Tool Use, Mathematics, Physics), and the size of the slice corresponds to the percentage of samples belonging to that category. The legend below each pie chart lists the categories and the number of samples in each category.
### Components/Axes
* **Titles:**
* Left Pie Chart: "SFT Dataset (Total: 14,117 samples)"
* Right Pie Chart: "RL Dataset (Total: 3,525 samples)"
* **Categories (SFT Dataset):**
* Tool Use
* Mathematics
* Physics
* Chemistry
* Economics
* Puzzle
* Other
* Business
* Finance
* History
* Biology
* Computer Science
* Psychology
* Other STEM
* Philosophy
* Engineering
* Law
* Health
* **Categories (RL Dataset):**
* Mathematics
* Economics
* Physics
* Business
* Finance
* Chemistry
* Engineering
* Biology
* Computer Science
* Health
* Other
* Other STEM
* Philosophy
* History
* Law
* Psychology
* **Percentages:** Displayed on each slice of the pie charts.
* **Legends:** Located below each pie chart, listing the categories and the number of samples in each.
### Detailed Analysis
**SFT Dataset:**
* **Tool Use:** Light Green, 35.2%, 4964 samples
* **Mathematics:** Light Blue, 19.3%, 2728 samples
* **Physics:** Blue, 11.6%, 1640 samples
* **Chemistry:** Green, 5.1%, 722 samples
* **Economics:** Purple, 2.4%, 343 samples
* **Puzzle:** Pink, 14.0%, 1977 samples
* **Other:** Yellow, 1.3%, 180 samples
* **Business:** Orange, 4.8%, 682 samples
* **Finance:** Light Pink, 2.8%, 395 samples
* **History:** Dark Yellow, 1.1%, 159 samples
* **Biology:** Dark Teal, 1.1%, 159 samples
* **Computer Science:** Red, 0.3%, 36 samples
* **Psychology:** Dark Orange, 0.3%, 41 samples
* **Other STEM:** Light Purple, 0.2%, 25 samples
* **Philosophy:** Salmon, 0.1%, 15 samples
* **Engineering:** Brown, 0.1%, 8 samples
* **Law:** Teal, 0.1%, 13 samples
* **Health:** Gray, 0.2%, 30 samples
**RL Dataset:**
* **Mathematics:** Light Blue, 23.0%, 809 samples
* **Economics:** Purple, 5.6%, 199 samples
* **Physics:** Blue, 32.5%, 1147 samples
* **Business:** Orange, 11.0%, 388 samples
* **Finance:** Light Pink, 10.0%, 351 samples
* **Chemistry:** Green, 14.5%, 512 samples
* **Engineering:** Brown, 0.6%, 21 samples
* **Biology:** Dark Teal, 0.9%, 31 samples
* **Computer Science:** Red, 0.3%, 12 samples
* **Health:** Gray, 0.1%, 5 samples
* **Other:** Yellow, 0.6%, 20 samples
* **Other STEM:** Light Purple, 0.3%, 9 samples
* **Philosophy:** Salmon, 0.2%, 6 samples
* **History:** Dark Yellow, 0.2%, 7 samples
* **Law:** Teal, 0.2%, 7 samples
* **Psychology:** Dark Orange, 0.03%, 1 samples
### Key Observations
* In the SFT Dataset, "Tool Use" constitutes the largest portion (35.2%), followed by "Mathematics" (19.3%) and "Physics" (11.6%).
* In the RL Dataset, "Physics" constitutes the largest portion (32.5%), followed by "Mathematics" (23.0%) and "Chemistry" (14.5%).
* The distribution of categories is significantly different between the two datasets. For example, "Tool Use" is a major category in the SFT Dataset but is not present in the RL Dataset.
* The "Other," "Other STEM," "Philosophy," "History," "Law," and "Psychology" categories have very small percentages in both datasets.
### Interpretation
The pie charts illustrate the composition of the SFT and RL datasets in terms of different categories. The significant differences in the distribution of categories between the two datasets suggest that they are designed for different purposes or represent different types of data. The SFT dataset seems to be heavily focused on "Tool Use," while the RL dataset emphasizes "Physics" and "Mathematics." The presence of categories like "Puzzle" in the SFT dataset and the varying proportions of other categories indicate different data collection or generation strategies. The small percentages of some categories in both datasets might indicate that these categories are less relevant or less frequently encountered in the respective contexts.