## Pie Charts: Dataset Composition - SFT vs. RL
### Overview
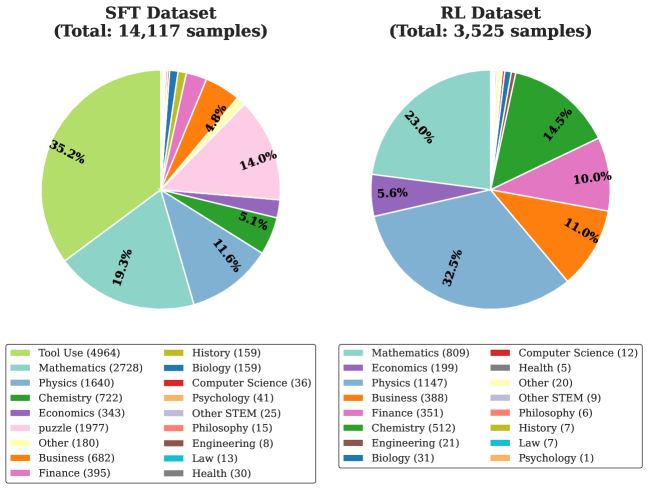
The image presents two pie charts, visually comparing the composition of two datasets: "SFT Dataset" (Supervised Fine-Tuning) and "RL Dataset" (Reinforcement Learning). The charts display the percentage distribution of various subject categories within each dataset. A legend at the bottom of the image maps colors to specific subject areas and provides the absolute sample counts for each category within each dataset.
### Components/Axes
The image consists of:
* **Two Pie Charts:** One labeled "SFT Dataset (Total: 14,117 samples)" and the other labeled "RL Dataset (Total: 3,525 samples)".
* **Legend:** Located at the bottom of the image, providing a color-coded key for the subject categories. The legend also lists the number of samples for each category within each dataset.
* **Percentage Labels:** Displayed on each pie chart slice, indicating the percentage of samples belonging to that category.
### Detailed Analysis or Content Details
**SFT Dataset (Total: 14,117 samples)**
* **Mathematics:** 35.2% (2728 samples) - Light Green
* **Physics:** 19.3% (1640 samples) - Blue
* **Chemistry:** 11.6% (722 samples) - Orange
* **Economics:** 5.1% (343 samples) - Yellow
* **Puzzle:** 14.0% (1977 samples) - Gold
* **Other:** 4.8% (678 samples) - Grey
* **Business:** 11.1% (682 samples) - Brown
* **Finance:** 14.0% (395 samples) - Pink
* **History:** 5.1% (159 samples) - Red
* **Biology:** 4.8% (159 samples) - Teal
* **Computer Science:** 1.1% (36 samples) - Dark Red
* **Psychology:** 0.3% (41 samples) - Purple
* **Other STEM:** 0.2% (25 samples) - Dark Grey
* **Philosophy:** 0.1% (15 samples) - Dark Blue
* **Engineering:** 0.1% (8 samples) - Black
* **Law:** 0.1% (13 samples) - Cyan
* **Health:** 0.2% (30 samples) - Magenta
**RL Dataset (Total: 3,525 samples)**
* **Mathematics:** 32.5% (809 samples) - Light Green
* **Economics:** 23.0% (199 samples) - Blue
* **Physics:** 5.6% (1147 samples) - Orange
* **Business:** 10.0% (388 samples) - Yellow
* **Chemistry:** 11.0% (512 samples) - Gold
* **Finance:** 14.5% (351 samples) - Grey
* **Other:** 10.0% (20 samples) - Brown
* **Engineering:** 11.1% (21 samples) - Pink
* **Biology:** 1.1% (31 samples) - Red
* **Computer Science:** 0.3% (12 samples) - Teal
* **Health:** 0.1% (5 samples) - Dark Red
* **Philosophy:** 0.2% (6 samples) - Purple
* **History:** 0.2% (7 samples) - Dark Grey
* **Law:** 0.0% (0 samples) - Dark Blue
* **Psychology:** 0.0% (1 samples) - Black
* **Other STEM:** 0.0% (0 samples) - Cyan
### Key Observations
* **Mathematics Dominance:** Mathematics is the most represented category in both datasets, comprising 35.2% of the SFT dataset and 32.5% of the RL dataset.
* **Physics Disparity:** Physics has a significantly larger representation in the SFT dataset (19.3%) compared to the RL dataset (5.6%).
* **Smaller Categories:** Categories like Philosophy, Engineering, Law, Health, and Psychology have very small representations in both datasets, particularly in the RL dataset.
* **Dataset Size Difference:** The SFT dataset is considerably larger than the RL dataset (14,117 vs. 3,525 samples).
* **Economics Increase:** Economics has a much larger percentage in the RL dataset (23.0%) compared to the SFT dataset (5.1%).
### Interpretation
The data suggests that the SFT dataset is more heavily focused on fundamental sciences like Mathematics and Physics, while the RL dataset has a greater emphasis on Economics and Mathematics. The difference in dataset sizes could indicate a different data collection strategy or a varying need for data in each learning paradigm. The small representation of categories like Philosophy and Law in both datasets suggests these areas are less prioritized or have limited available data for these specific training purposes. The shift in emphasis from Physics to Economics between the SFT and RL datasets could reflect the types of problems these models are being trained to solve – SFT potentially focusing on foundational knowledge, while RL might be geared towards more applied, economic-related tasks. The very small sample sizes for some categories raise questions about the generalizability of models trained on these datasets to those specific areas. The data highlights the importance of considering dataset composition when evaluating and deploying these models, as biases in the data can lead to biased model performance.