## Pie Charts: SFT Dataset vs RL Dataset
### Overview
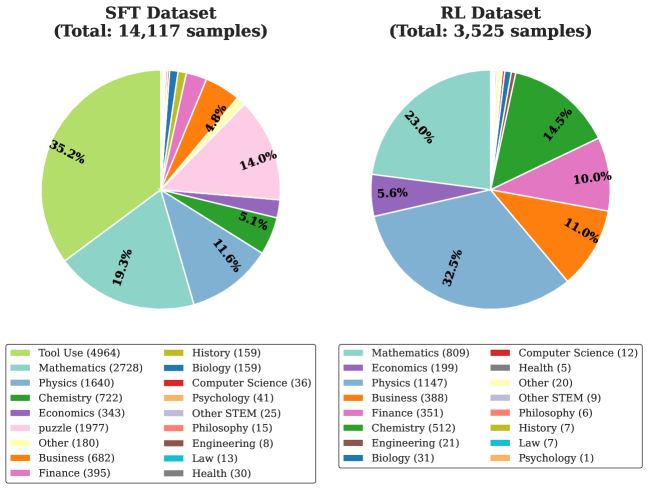
The image compares two pie charts representing the distribution of samples across categories in two datasets:
- **SFT Dataset**: Total of 14,117 samples.
- **RL Dataset**: Total of 3,525 samples.
Each chart uses color-coded segments to show the proportion of samples per category, with legends providing category names and sample counts.
---
### Components/Axes
#### Legends
- **SFT Dataset Legend** (bottom-left):
- Tool Use (green, 4,964 samples)
- Mathematics (light blue, 2,728)
- Physics (blue, 1,640)
- Chemistry (dark green, 722)
- Economics (purple, 343)
- Puzzle (pink, 1,977)
- Other (yellow, 180)
- Business (orange, 682)
- Finance (magenta, 395)
- History (light green, 159)
- Biology (cyan, 159)
- Computer Science (red, 36)
- Psychology (brown, 41)
- Other STEM (gray, 25)
- Philosophy (light red, 15)
- Engineering (dark brown, 8)
- Law (turquoise, 13)
- Health (dark gray, 30)
- **RL Dataset Legend** (bottom-right):
- Mathematics (light blue, 809)
- Economics (purple, 199)
- Physics (blue, 1,147)
- Business (orange, 388)
- Finance (magenta, 351)
- Chemistry (dark green, 512)
- Engineering (dark brown, 21)
- Biology (cyan, 31)
- Computer Science (red, 12)
- Health (dark gray, 5)
- Other (yellow, 20)
- Other STEM (gray, 9)
- Philosophy (light red, 6)
- History (light green, 7)
- Law (turquoise, 7)
- Psychology (brown, 1)
#### Chart Structure
- Both charts use radial segments with percentages labeled inside each slice.
- SFT Dataset dominates with larger sample counts (14,117 vs. 3,525).
- RL Dataset has fewer categories (16 vs. 19 in SFT).
---
### Detailed Analysis
#### SFT Dataset
1. **Tool Use**: 35.2% (4,964 samples) – Largest category.
2. **Mathematics**: 19.3% (2,728).
3. **Physics**: 11.6% (1,640).
4. **Puzzle**: 14.0% (1,977).
5. **Business**: 4.8% (682).
6. **Chemistry**: 5.1% (722).
7. **Economics**: 2.4% (343).
8. **Finance**: 2.8% (395).
9. **Other STEM**: 0.2% (25).
10. **History/Biology**: 1.1% each (159).
11. **Smaller categories**: Computer Science (0.3%), Psychology (0.3%), Engineering (0.1%), Law (0.1%), Health (0.2%).
#### RL Dataset
1. **Physics**: 32.5% (1,147) – Largest category.
2. **Mathematics**: 23.0% (809).
3. **Chemistry**: 14.5% (512).
4. **Business**: 11.0% (388).
5. **Finance**: 10.0% (351).
6. **Economics**: 5.6% (199).
7. **Smaller categories**: Engineering (0.6%), Biology (0.9%), Computer Science (0.3%), Health (0.1%), Other STEM (0.3%), Philosophy (0.2%), History/Law (0.2% each).
---
### Key Observations
1. **SFT Dataset Dominance**:
- Tool Use (35.2%) and Mathematics (19.3%) together account for over 54% of samples.
- Puzzle (14.0%) and Physics (11.6%) are significant but smaller.
- Many categories (e.g., Engineering, Law) have <1% representation.
2. **RL Dataset Diversity**:
- Physics (32.5%) and Mathematics (23.0%) dominate, but the distribution is more evenly spread.
- Chemistry (14.5%) and Business (11.0%) are notable mid-sized categories.
- Engineering, Biology, and Computer Science have minimal representation (<1%).
3. **Category Overlap**:
- Both datasets include Mathematics, Physics, Chemistry, and Business, but with differing proportions.
- SFT has unique categories like Puzzle and Engineering; RL includes unique categories like Psychology and Law.
4. **Sample Size Impact**:
- SFT’s larger total (14,117 vs. 3,525) results in higher absolute counts for overlapping categories (e.g., Mathematics: 2,728 vs. 809).
---
### Interpretation
1. **Focus vs. Breadth**:
- The SFT Dataset emphasizes **Tool Use** and **Mathematics**, suggesting a focus on foundational or technical applications.
- The RL Dataset prioritizes **Physics** and **Mathematics**, with a broader spread across scientific and business domains.
2. **Niche Categories**:
- SFT’s "Puzzle" (14.0%) and RL’s "Finance" (10.0%) indicate specialized applications within their respective datasets.
- Minimal representation of Engineering, Law, and Health in both datasets may reflect underrepresentation or emerging fields.
3. **Data Imbalance**:
- SFT’s "Other" category (0.2%) and RL’s "Other STEM" (0.3%) highlight potential gaps in categorization or data collection.
4. **Practical Implications**:
- SFT’s concentration on Tool Use and Mathematics could imply optimization for technical tasks.
- RL’s diversity suggests applications in interdisciplinary or research-oriented contexts.
5. **Anomalies**:
- SFT’s "Engineering" (0.1%) and RL’s "Psychology" (0.1%) are outliers with negligible sample counts, possibly indicating data entry errors or niche use cases.
---
### Conclusion
The SFT Dataset is heavily skewed toward technical and mathematical domains, while the RL Dataset shows a more balanced distribution across scientific and business fields. These differences may reflect distinct training objectives or application scenarios for each dataset.