## Line Graph: Answer Accuracy Across Layers for Llama-3-8B and Llama-3-70B Models
### Overview
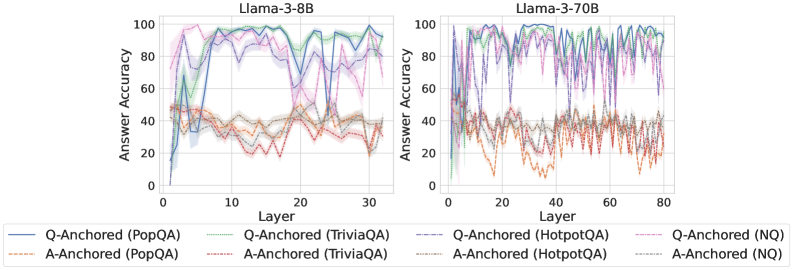
The image contains two side-by-side line graphs comparing answer accuracy across neural network layers for two versions of the Llama-3 model (8B and 70B parameters). Each graph tracks performance across multiple anchoring methods (Q-Anchored and A-Anchored) and datasets (PopQA, TriviaQA, HotpotQA, NQ). The graphs show significant variability in accuracy across layers, with distinct patterns emerging between model sizes.
### Components/Axes
- **X-axis (Layer)**:
- Llama-3-8B: 0–30 layers
- Llama-3-70B: 0–80 layers
- **Y-axis (Answer Accuracy)**: 0–100% scale
- **Legends**:
- **Line styles/colors**:
- Solid lines: Q-Anchored methods
- Dashed lines: A-Anchored methods
- Colors correspond to datasets:
- Blue: PopQA
- Green: TriviaQA
- Purple: HotpotQA
- Red: NQ
- Legend positioned at bottom center, spanning both charts
### Detailed Analysis
#### Llama-3-8B (Left Chart)
- **Q-Anchored (PopQA)**: Starts at ~80% accuracy, drops sharply to ~20% at layer 5, then fluctuates between 40–80% with peaks at layers 10, 15, and 25.
- **A-Anchored (PopQA)**: Begins at ~50%, dips to ~30% at layer 5, then stabilizes between 30–50% with minor oscillations.
- **Q-Anchored (TriviaQA)**: Peaks at ~90% at layer 10, crashes to ~10% at layer 15, then recovers to ~70% by layer 30.
- **A-Anchored (TriviaQA)**: Starts at ~60%, drops to ~40% at layer 10, then stabilizes between 40–60%.
- **Q-Anchored (HotpotQA)**: Sharp drop from ~70% to ~20% at layer 5, followed by erratic fluctuations between 30–70%.
- **A-Anchored (HotpotQA)**: Starts at ~50%, dips to ~30% at layer 5, then stabilizes between 30–50%.
- **Q-Anchored (NQ)**: Begins at ~60%, drops to ~20% at layer 5, then fluctuates between 40–60%.
- **A-Anchored (NQ)**: Starts at ~50%, dips to ~30% at layer 5, then stabilizes between 30–50%.
#### Llama-3-70B (Right Chart)
- **Q-Anchored (PopQA)**: Starts at ~90%, drops to ~30% at layer 10, then fluctuates between 50–90% with peaks at layers 20, 40, and 60.
- **A-Anchored (PopQA)**: Begins at ~60%, dips to ~40% at layer 10, then stabilizes between 40–60%.
- **Q-Anchored (TriviaQA)**: Peaks at ~95% at layer 20, crashes to ~15% at layer 30, then recovers to ~80% by layer 70.
- **A-Anchored (TriviaQA)**: Starts at ~70%, dips to ~50% at layer 20, then stabilizes between 50–70%.
- **Q-Anchored (HotpotQA)**: Sharp drop from ~80% to ~25% at layer 10, followed by erratic fluctuations between 40–80%.
- **A-Anchored (HotpotQA)**: Starts at ~60%, dips to ~40% at layer 10, then stabilizes between 40–60%.
- **Q-Anchored (NQ)**: Begins at ~70%, drops to ~20% at layer 10, then fluctuates between 50–70%.
- **A-Anchored (NQ)**: Starts at ~60%, dips to ~40% at layer 10, then stabilizes between 40–60%.
### Key Observations
1. **Model Size Impact**: The 70B model shows more pronounced fluctuations in accuracy across layers compared to the 8B model.
2. **Anchoring Method Differences**:
- Q-Anchored methods generally start with higher accuracy but experience sharper drops in early layers.
- A-Anchored methods exhibit more stability but lower baseline accuracy.
3. **Dataset Variability**:
- HotpotQA and NQ datasets show the most erratic patterns, particularly in the 70B model.
- TriviaQA demonstrates the highest peaks in accuracy for both models.
4. **Confidence Intervals**: Shaded regions (not explicitly labeled) suggest wider uncertainty in the 70B model’s predictions.
### Interpretation
The data suggests that larger models (70B) exhibit greater layer-to-layer variability in answer accuracy, potentially due to increased complexity or overfitting. Q-Anchored methods outperform A-Anchored methods in early layers but become less reliable in deeper layers for certain datasets. The TriviaQA dataset consistently shows the highest accuracy peaks, indicating it may be better aligned with the models’ training data. The sharp drops in accuracy for Q-Anchored methods at specific layers (e.g., layer 5 in 8B, layer 10 in 70B) could reflect architectural bottlenecks or dataset-specific challenges. The stability of A-Anchored methods across layers implies they may be more robust to model size changes but sacrifice peak performance. Further investigation into dataset-model alignment and anchoring strategy trade-offs is warranted.