\n
## Line Chart: Answer Accuracy vs. Layer for Llama Models
### Overview
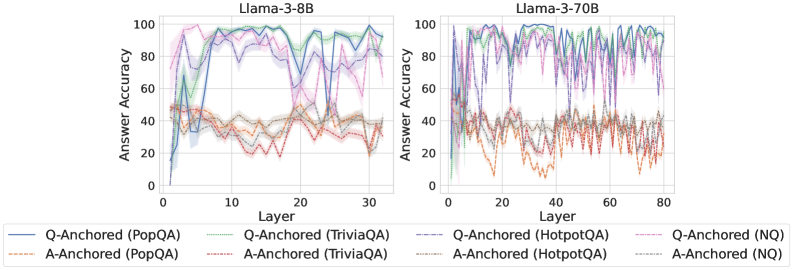
The image presents two line charts comparing the answer accuracy of different question-answering (QA) datasets across layers of two Llama models: Llama-3-8B and Llama-3-70B. The x-axis represents the layer number, and the y-axis represents the answer accuracy, ranging from 0 to 100. Each line represents a specific QA dataset and anchoring method.
### Components/Axes
* **X-axis:** Layer (ranging from approximately 0 to 30 for Llama-3-8B and 0 to 80 for Llama-3-70B).
* **Y-axis:** Answer Accuracy (ranging from 0 to 100).
* **Left Chart Title:** Llama-3-8B
* **Right Chart Title:** Llama-3-70B
* **Legend:**
* Q-Anchored (PopQA) - Blue line
* A-Anchored (PopQA) - Light Brown line
* Q-Anchored (TriviaQA) - Green line
* A-Anchored (TriviaQA) - Purple line
* Q-Anchored (HotpotQA) - Dashed Purple line
* A-Anchored (HotpotQA) - Dashed Brown line
* Q-Anchored (NQ) - Light Blue line
* A-Anchored (NQ) - Orange line
### Detailed Analysis or Content Details
**Llama-3-8B Chart:**
* **Q-Anchored (PopQA):** The blue line starts at approximately 10% accuracy at layer 0, rapidly increases to around 90% by layer 5, fluctuates between 80% and 95% for layers 5-25, and then decreases to around 85% by layer 30.
* **A-Anchored (PopQA):** The light brown line starts at approximately 20% accuracy at layer 0, increases to around 40% by layer 5, and remains relatively stable between 30% and 50% for the rest of the layers.
* **Q-Anchored (TriviaQA):** The green line starts at approximately 20% accuracy at layer 0, increases to around 90% by layer 5, and fluctuates between 80% and 95% for layers 5-25, and then decreases to around 80% by layer 30.
* **A-Anchored (TriviaQA):** The purple line starts at approximately 20% accuracy at layer 0, increases to around 60% by layer 5, and remains relatively stable between 50% and 70% for the rest of the layers.
* **Q-Anchored (HotpotQA):** The dashed purple line starts at approximately 10% accuracy at layer 0, increases to around 80% by layer 5, and fluctuates between 70% and 90% for layers 5-25, and then decreases to around 75% by layer 30.
* **A-Anchored (HotpotQA):** The dashed brown line starts at approximately 10% accuracy at layer 0, increases to around 40% by layer 5, and remains relatively stable between 30% and 50% for the rest of the layers.
* **Q-Anchored (NQ):** The light blue line starts at approximately 10% accuracy at layer 0, increases to around 70% by layer 5, and fluctuates between 60% and 80% for layers 5-25, and then decreases to around 65% by layer 30.
* **A-Anchored (NQ):** The orange line starts at approximately 10% accuracy at layer 0, increases to around 30% by layer 5, and remains relatively stable between 20% and 40% for the rest of the layers.
**Llama-3-70B Chart:**
The trends are similar to the Llama-3-8B chart, but the fluctuations are more pronounced and the layer range is extended to 80. All lines exhibit similar oscillatory behavior, peaking around 80-100% accuracy at various points and dipping to lower values. The A-Anchored lines consistently remain lower in accuracy than the Q-Anchored lines across all datasets.
### Key Observations
* **Q-Anchored consistently outperforms A-Anchored:** Across all datasets and both models, the Q-Anchored lines generally exhibit higher answer accuracy than the A-Anchored lines.
* **Initial Accuracy Increase:** All lines show a significant increase in accuracy within the first 5 layers.
* **Fluctuations:** The accuracy fluctuates significantly across layers, particularly in the Llama-3-70B model.
* **Model Size Impact:** The Llama-3-70B model exhibits more pronounced fluctuations in accuracy compared to the Llama-3-8B model.
### Interpretation
The data suggests that question anchoring (Q-Anchored) is a more effective method for improving answer accuracy in both Llama models compared to answer anchoring (A-Anchored). The initial rapid increase in accuracy across all datasets indicates that the early layers of the models are crucial for capturing basic question-answering capabilities. The subsequent fluctuations in accuracy suggest that deeper layers may be more sensitive to the specific characteristics of each dataset. The more pronounced fluctuations in the Llama-3-70B model could be attributed to its larger size and increased complexity, allowing it to capture more nuanced patterns but also making it more susceptible to overfitting or noise in the data. The consistent lower performance of A-Anchored methods suggests that focusing on the question itself, rather than the answer, is more beneficial for improving the model's ability to retrieve accurate information. The oscillatory behavior could be due to the model learning and unlearning patterns as it progresses through the layers, or it could be an artifact of the training process. Further investigation would be needed to determine the underlying cause of these fluctuations.