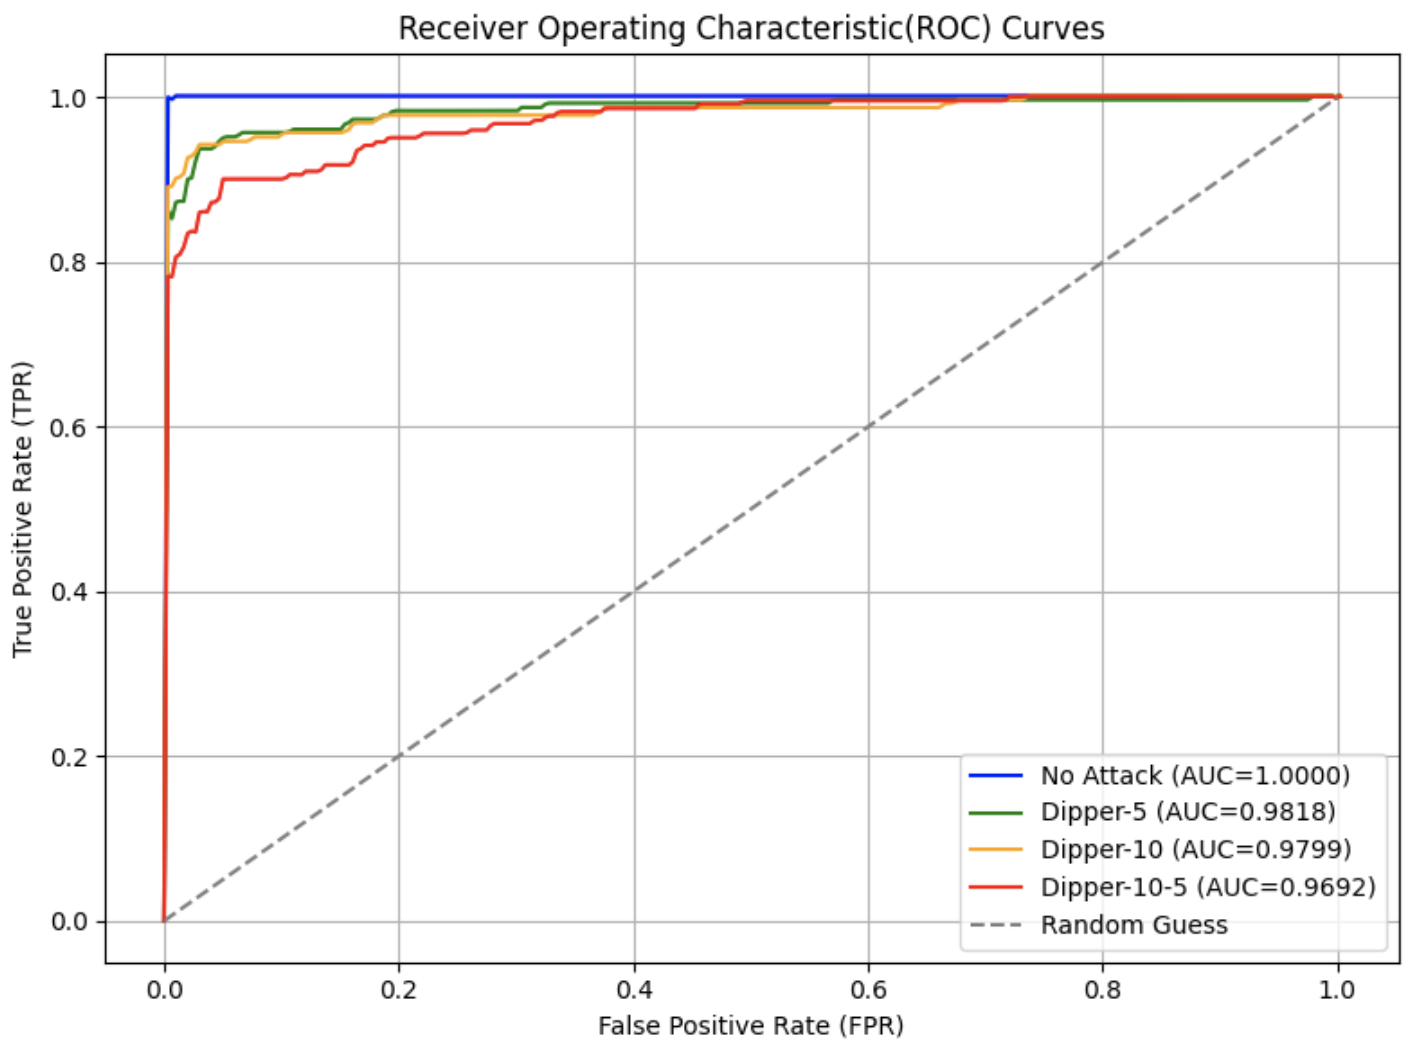
## Chart: Receiver Operating Characteristic (ROC) Curves
### Overview
The image displays a Receiver Operating Characteristic (ROC) curve chart comparing the performance of four models: "No Attack," "Dipper-5," "Dipper-10," and "Dipper-10-5," against a "Random Guess" baseline. The chart evaluates the trade-off between True Positive Rate (TPR) and False Positive Rate (FPR) for each model, with AUC (Area Under the Curve) values provided in the legend.
### Components/Axes
- **X-axis**: False Positive Rate (FPR), ranging from 0.0 to 1.0 in increments of 0.2.
- **Y-axis**: True Positive Rate (TPR), ranging from 0.0 to 1.0 in increments of 0.2.
- **Legend**: Located in the bottom-right corner, with the following entries:
- **Blue**: No Attack (AUC=1.0000)
- **Green**: Dipper-5 (AUC=0.9818)
- **Orange**: Dipper-10 (AUC=0.9799)
- **Red**: Dipper-10-5 (AUC=0.9692)
- **Dashed Gray**: Random Guess (diagonal line from (0,0) to (1,1)).
### Detailed Analysis
1. **No Attack (Blue Line)**:
- A horizontal line at TPR=1.0, indicating perfect detection with no false positives. This is an idealized scenario, as it suggests no false alarms occur.
- AUC=1.0000 confirms perfect classification.
2. **Dipper-5 (Green Line)**:
- Starts at (0,0) and rises sharply to (1,1), with a smooth, near-linear trajectory.
- AUC=0.9818 indicates high performance, slightly below the ideal.
3. **Dipper-10 (Orange Line)**:
- Similar trajectory to Dipper-5 but with a slightly flatter slope, indicating marginally lower performance.
- AUC=0.9799, slightly lower than Dipper-5.
4. **Dipper-10-5 (Red Line)**:
- Starts at (0,0) but has a more gradual ascent compared to Dipper-5 and Dipper-10.
- AUC=0.9692, the lowest among the Dipper models, suggesting reduced effectiveness.
5. **Random Guess (Dashed Gray Line)**:
- A diagonal line from (0,0) to (1,1), representing a baseline performance where TPR equals FPR.
- All models outperform this baseline.
### Key Observations
- **No Attack** is the only model achieving perfect performance (AUC=1.0000), but this is unrealistic in practice.
- **Dipper-5** outperforms the other Dipper models, with the highest AUC (0.9818).
- **Dipper-10-5** has the lowest AUC (0.9692), indicating it is the least effective among the Dipper variants.
- All models (except No Attack) start at (0,0) and end at (1,1), but their paths diverge, reflecting differences in discrimination ability.
### Interpretation
The ROC curves demonstrate that:
- **No Attack** is theoretically optimal but impractical, as it assumes no false positives.
- **Dipper-5** is the most effective model among the Dipper variants, balancing high TPR and low FPR.
- **Dipper-10-5** underperforms compared to Dipper-5 and Dipper-10, suggesting that its configuration or parameters may be suboptimal.
- The **Random Guess** line serves as a critical benchmark, confirming that all models provide meaningful improvements over chance performance.
The AUC values quantify the models' ability to distinguish between classes, with higher values indicating better performance. The slight decline in AUC from Dipper-5 to Dipper-10-5 highlights the importance of model tuning to maximize discrimination.