## Chart Type: Receiver Operating Characteristic (ROC) Curves
### Overview
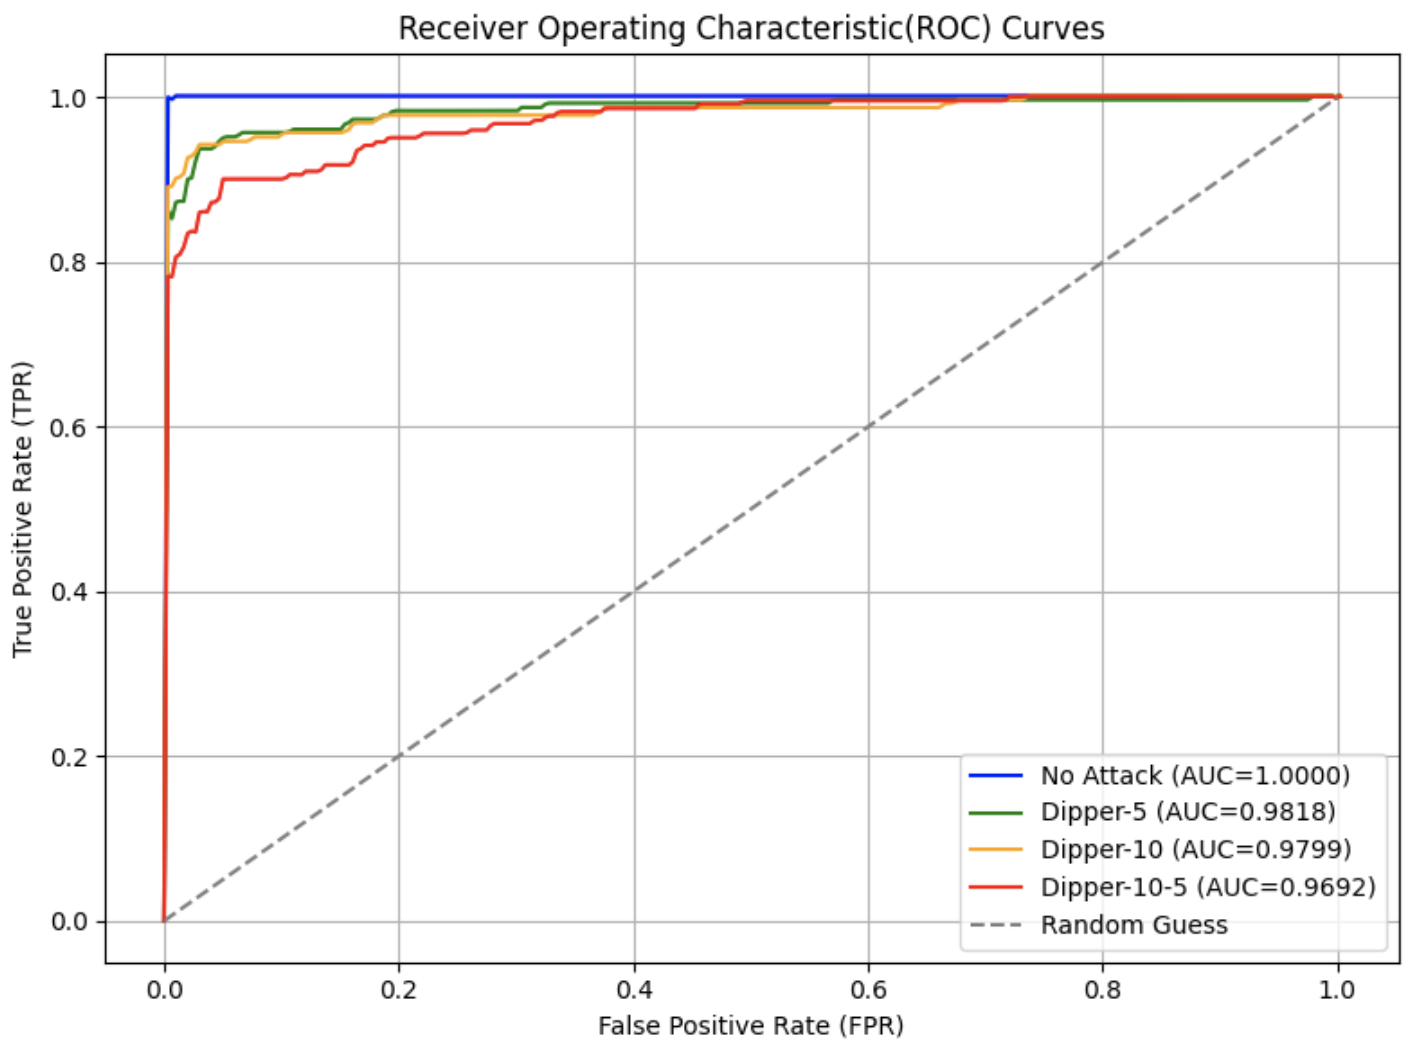
The image is a Receiver Operating Characteristic (ROC) curve chart, comparing the performance of different attack scenarios (No Attack, Dipper-5, Dipper-10, Dipper-10-5) against a random guess baseline. The chart plots the True Positive Rate (TPR) against the False Positive Rate (FPR). The Area Under the Curve (AUC) is provided for each scenario, indicating the model's ability to distinguish between positive and negative classes.
### Components/Axes
* **Title:** Receiver Operating Characteristic (ROC) Curves
* **X-axis:** False Positive Rate (FPR), ranging from 0.0 to 1.0 in increments of 0.2.
* **Y-axis:** True Positive Rate (TPR), ranging from 0.0 to 1.0 in increments of 0.2.
* **Legend:** Located in the bottom-right corner, it identifies the different attack scenarios and their corresponding AUC values:
* Blue: No Attack (AUC=1.0000)
* Green: Dipper-5 (AUC=0.9818)
* Orange: Dipper-10 (AUC=0.9799)
* Red: Dipper-10-5 (AUC=0.9692)
* Dashed Gray: Random Guess
### Detailed Analysis
* **No Attack (Blue):** The blue line rises sharply to a TPR of 1.0 at a very low FPR (close to 0.0), and remains at 1.0 for all subsequent FPR values. This indicates perfect classification.
* **Dipper-5 (Green):** The green line rises quickly, reaching a TPR of approximately 0.9 at an FPR of around 0.05. It then gradually increases to 1.0 as the FPR approaches 0.4.
* **Dipper-10 (Orange):** The orange line follows a similar trend to Dipper-5, but its initial rise is slightly slower. It reaches a TPR of approximately 0.8 at an FPR of around 0.05, and gradually increases to 1.0 as the FPR approaches 0.4.
* **Dipper-10-5 (Red):** The red line has the slowest initial rise among the attack scenarios. It reaches a TPR of approximately 0.8 at an FPR of around 0.1, and gradually increases to 1.0 as the FPR approaches 0.4.
* **Random Guess (Dashed Gray):** The dashed gray line represents a random guess, with TPR equal to FPR. It is a diagonal line from (0.0, 0.0) to (1.0, 1.0).
### Key Observations
* The "No Attack" scenario has the highest AUC (1.0000), indicating perfect classification.
* The "Dipper-10-5" scenario has the lowest AUC (0.9692) among the attack scenarios, indicating the worst performance.
* All attack scenarios outperform the "Random Guess" baseline.
* The ROC curves for "Dipper-5" and "Dipper-10" are very close, suggesting similar performance.
### Interpretation
The ROC curves illustrate the performance of different attack scenarios in terms of their ability to correctly classify events. The "No Attack" scenario represents an ideal situation where the system can perfectly distinguish between positive and negative cases. The "Dipper" attack scenarios represent varying degrees of compromise, with "Dipper-10-5" being the most challenging to detect. The AUC values provide a quantitative measure of the performance of each scenario, with higher AUC values indicating better performance. The fact that all attack scenarios outperform the "Random Guess" baseline suggests that the system has some ability to detect these attacks. The closer the ROC curve is to the top-left corner, the better the performance of the model.