## Diagram: Fact-Check Analysis of Health Claims
### Overview
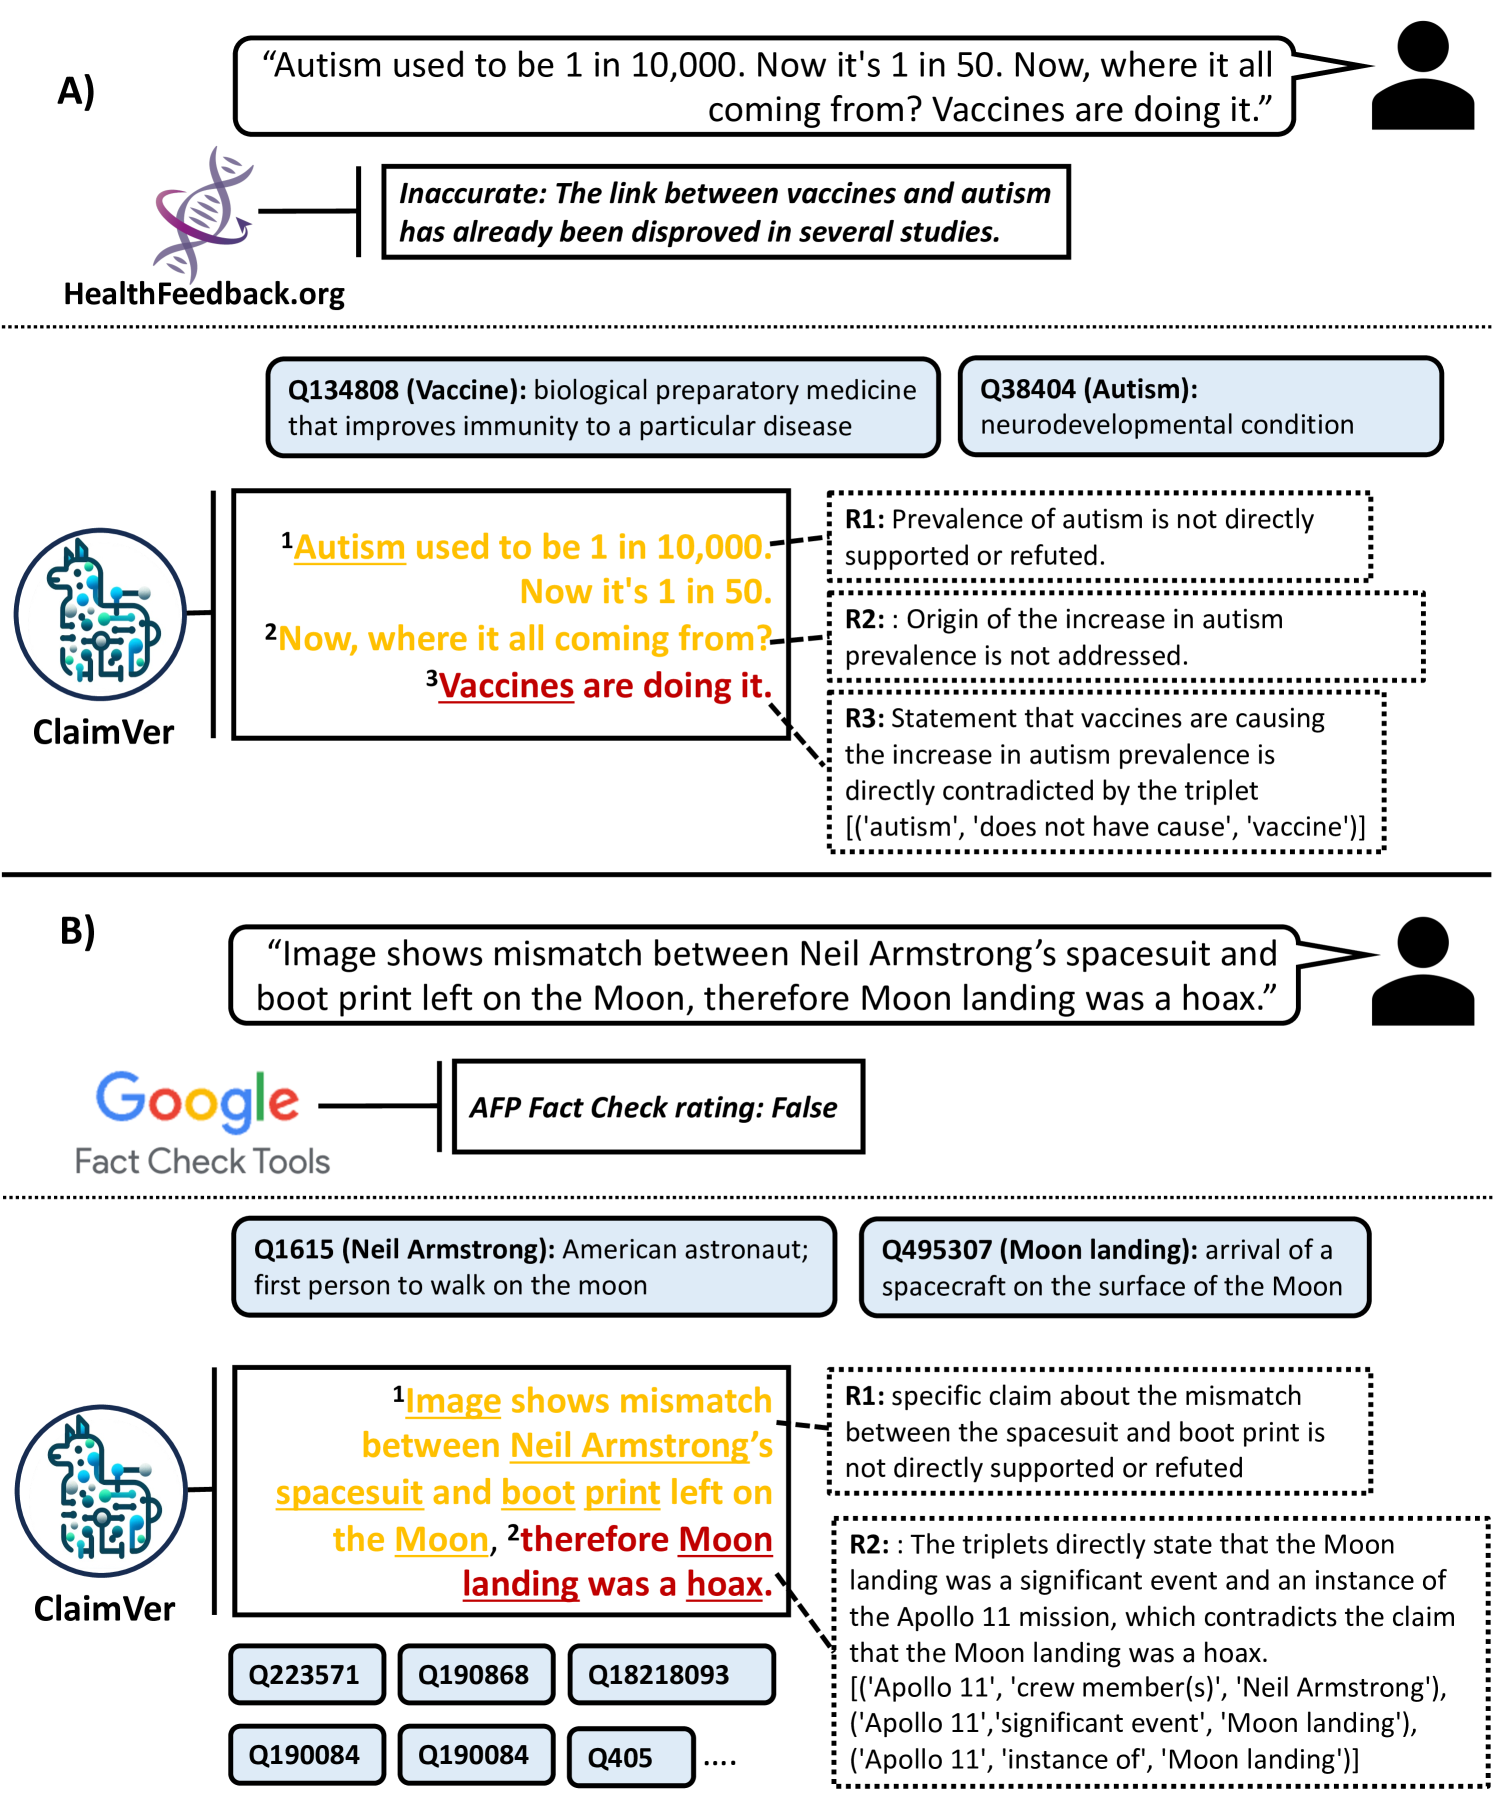
The image presents two diagrams (labeled A and B) illustrating a fact-check analysis of health-related claims. Both diagrams utilize a similar structure, employing a knowledge graph approach to dissect claims, identify related entities, and assess their validity. The diagrams visually represent the relationship between a claim, supporting/opposing evidence, and a final fact-check rating.
### Components/Axes
Each diagram consists of the following components:
* **Claim Box:** A rectangular box containing the original claim in quotation marks.
* **Entity Boxes:** Smaller boxes representing key entities mentioned in the claim, linked to Wikidata IDs (e.g., Q134808 for Vaccine).
* **Relationship Arrows:** Arrows connecting the claim to entities and to reasoning statements (R1, R2, R3).
* **Reasoning Statements (R1-R3):** Boxes outlining the reasoning behind the fact-check rating.
* **Fact-Check Rating:** A box indicating the overall fact-check rating (e.g., "False").
* **Source Logos:** Logos of organizations involved (HealthFeedback.org, Google, ClaimVer, AFP Fact Check).
* **Wikidata IDs:** Numerical identifiers linking entities to Wikidata.
* **Additional Wikidata IDs:** A series of IDs at the bottom of diagram B, representing related entities.
### Detailed Analysis or Content Details
**Diagram A: Autism and Vaccines**
* **Claim:** "Autism used to be 1 in 10,000. Now it’s 1 in 50. Now, where it all coming from? Vaccines are doing it."
* **Entities:**
* Q134808 (Vaccine): biological preparatory medicine that improves immunity to a particular disease.
* Q38404 (Autism): neurodevelopmental condition.
* **Relationships & Reasoning:**
* R1: Prevalence of autism is not directly supported or refuted.
* R2: Origin of the increase in autism prevalence is not addressed.
* R3: Statement that vaccines are causing the increase in autism prevalence is directly contradicted by the triplet ('autism', 'does not have cause', 'vaccine').
* **Source:** HealthFeedback.org, ClaimVer
* **Annotation:** "Inaccurate: The link between vaccines and autism has already been disproven in several studies."
**Diagram B: Moon Landing Hoax**
* **Claim:** "Image shows mismatch between Neil Armstrong’s spacesuit and boot print left on the Moon, therefore Moon landing was a hoax."
* **Entities:**
* Q1615 (Neil Armstrong): American astronaut; the first person to walk on the moon.
* Q495307 (Moon landing): arrival of the Moon spacecraft on the surface of the Moon.
* **Relationships & Reasoning:**
* R1: specific claim about the mismatch between the spacesuit and boot print is not directly supported or refuted.
* R2: The triplets directly state that the Moon landing was a significant event and an instance of the Apollo 11 mission, which contradicts the claim that the Moon landing was a hoax.
* **Fact-Check Rating:** AFP Fact Check rating: False
* **Source:** Google, ClaimVer
* **Additional Wikidata IDs:** Q223571, Q190868, Q18218093, Q190084, Q190084, Q405.
### Key Observations
* Both diagrams follow a consistent structure for dissecting and evaluating claims.
* The diagrams leverage Wikidata IDs to provide context and link entities to a broader knowledge base.
* The reasoning statements (R1-R3) break down the claim into smaller components and assess their validity.
* The fact-check ratings are clearly displayed, providing a concise summary of the analysis.
* Diagram A explicitly labels the claim as "Inaccurate" with a supporting annotation.
* Diagram B relies on the "False" rating from AFP Fact Check.
### Interpretation
These diagrams demonstrate a systematic approach to fact-checking, utilizing knowledge graphs and logical reasoning. The diagrams aim to deconstruct complex claims into their constituent parts, identify relevant entities, and assess the validity of the relationships between them. The use of Wikidata IDs suggests an attempt to ground the analysis in a verifiable and interconnected knowledge base. The diagrams highlight the importance of evidence-based reasoning and the potential for misinformation to spread through unsubstantiated claims. The consistent structure across both diagrams suggests a standardized methodology for fact-checking, potentially scalable for analyzing a wide range of claims. The diagrams are not simply presenting data; they are *demonstrating* a process of critical analysis. The inclusion of Wikidata IDs is a key element, indicating a commitment to transparency and verifiability. The diagrams are designed to be informative and persuasive, aiming to counter misinformation by presenting a clear and logical assessment of the claims.