TECHNICAL ASSET FINGERPRINT
8066738e0d3ffd54ef1b5010
Click to view fullscreen
Press ESC or click to close
FOUND IN PAPERS
EXPERT: healer-alpha-free VERSION 1
RUNTIME: free/openrouter/healer-alpha
INTEL_VERIFIED
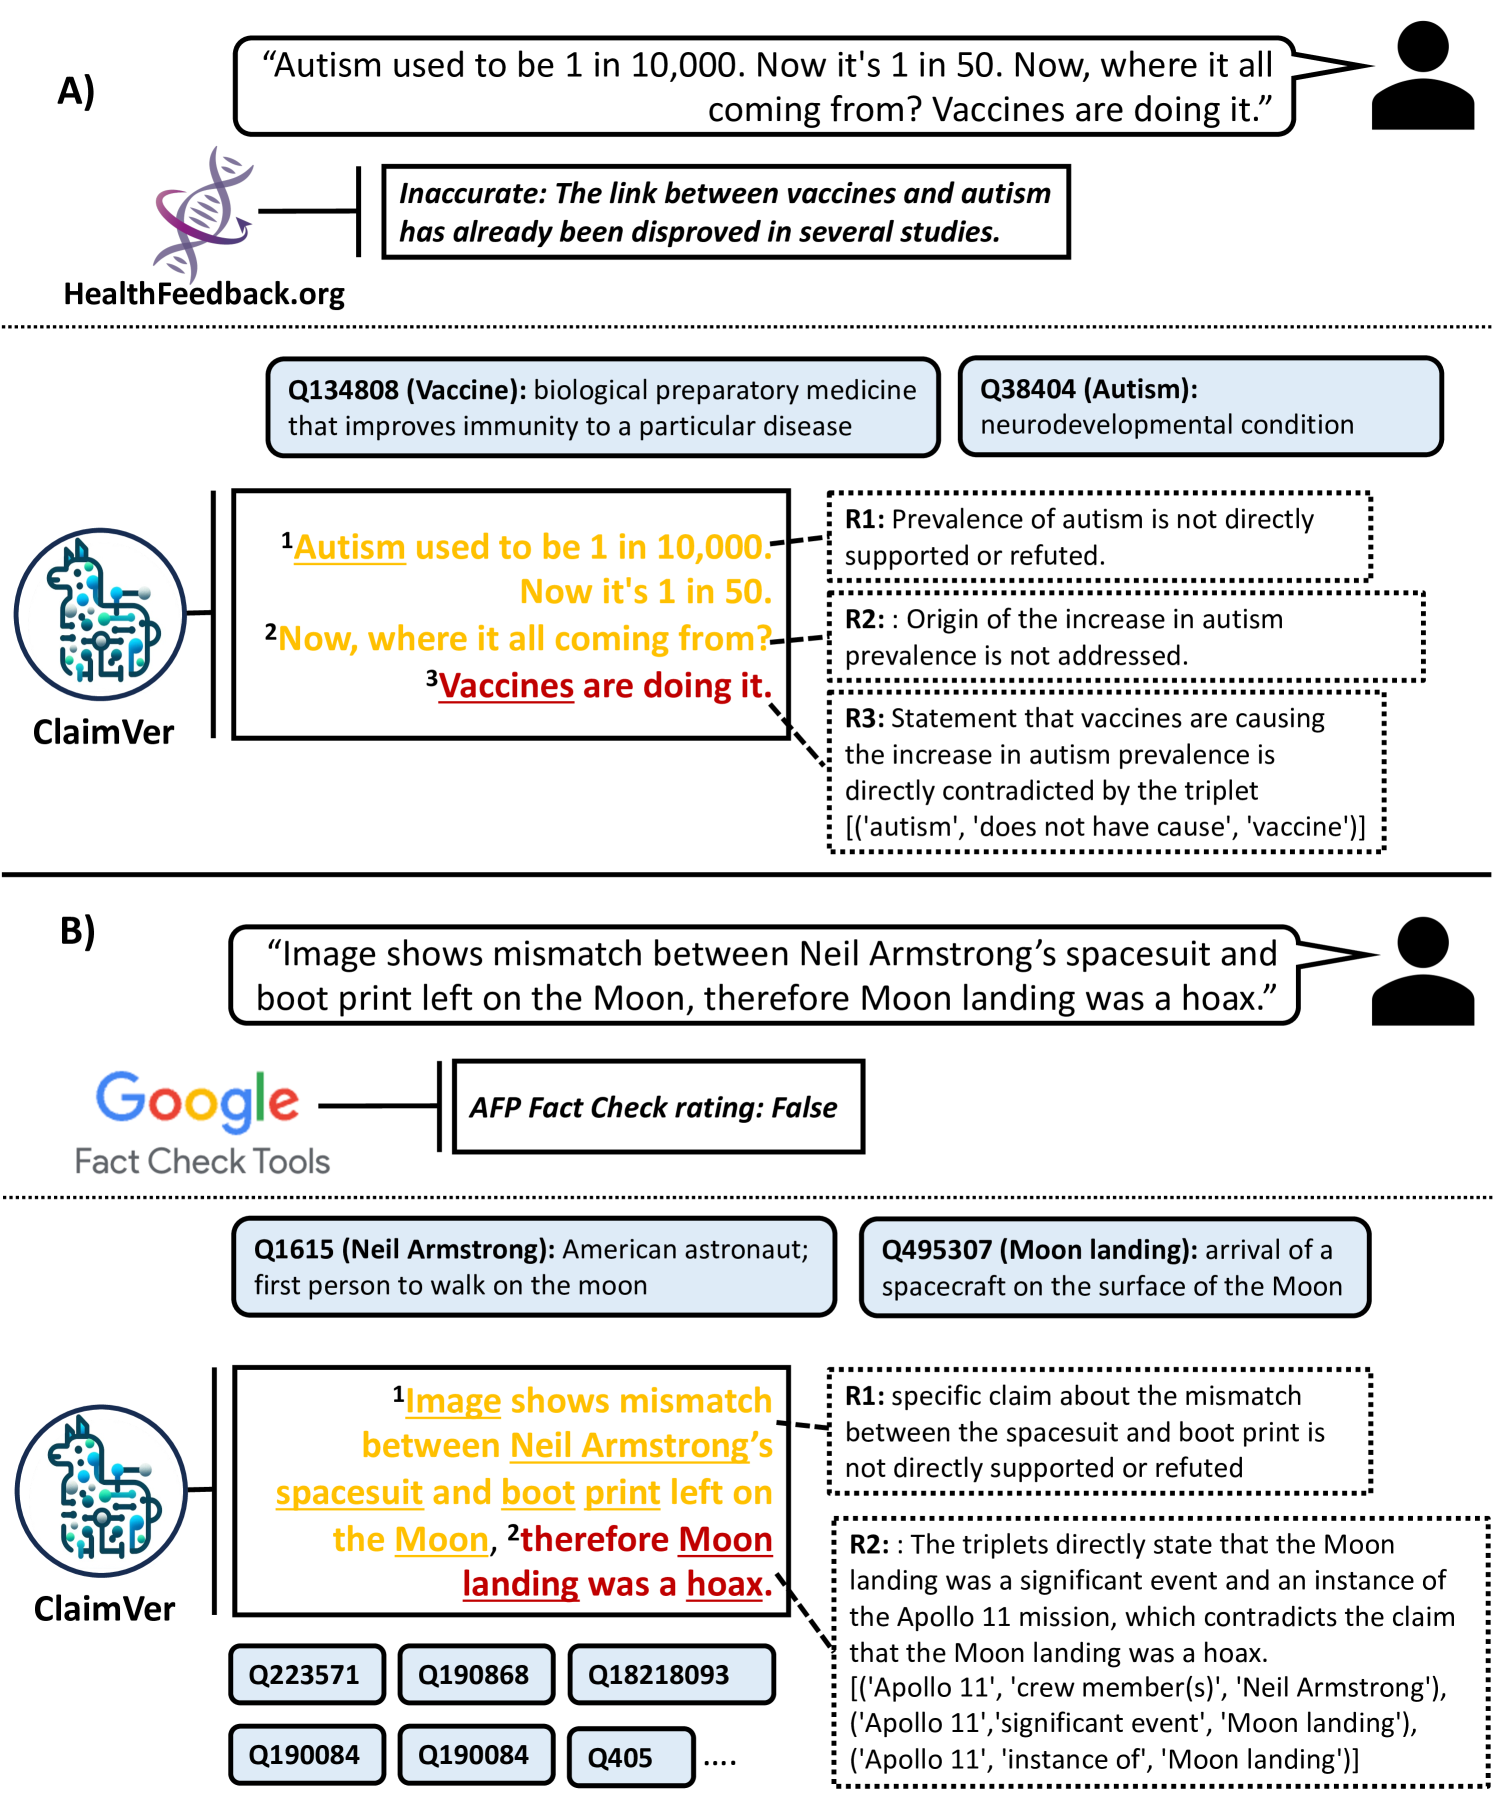
## Diagram: Fact-Checking Claim Analysis Comparison
### Overview
The image is a two-part diagram (labeled A and B) illustrating and comparing the analysis of two different factual claims by two different systems: a traditional fact-checking source (HealthFeedback.org in part A, Google Fact Check Tools in part B) and a system called "ClaimVer." The diagram demonstrates how ClaimVer deconstructs claims into components and evaluates them against structured knowledge (represented by Q-codes and triplets).
### Components/Axes
The diagram is divided into two horizontal sections, A and B, separated by a dashed line. Each section follows a similar flow:
1. **Claim Source:** A silhouette of a person with a speech bubble containing the original claim.
2. **Traditional Fact-Check:** A logo and a box containing the fact-checking organization's verdict.
3. **ClaimVer Analysis:** A detailed breakdown featuring:
* **Knowledge Definitions:** Boxes with Q-codes (e.g., Q134808) defining key terms.
* **Claim Deconstruction:** The original claim text, segmented and color-coded (yellow for premises, red for the main assertion).
* **Structured Responses:** Dotted-line boxes labeled R1, R2, R3 containing ClaimVer's analysis of each segment.
* **Knowledge Triplets:** In part B, additional Q-code boxes and a list of triplets in brackets (e.g., `[('Apollo 11', 'crew member(s)', 'Neil Armstrong')]`).
### Detailed Analysis
#### **Section A: Vaccine-Autism Claim**
* **Original Claim (Top Center):** "Autism used to be 1 in 10,000. Now it's 1 in 50. Now, where it all coming from? Vaccines are doing it."
* **Traditional Fact-Check (Left):**
* **Source:** HealthFeedback.org (logo with DNA helix).
* **Verdict:** "Inaccurate: The link between vaccines and autism has already been disproved in several studies."
* **ClaimVer Analysis (Bottom):**
* **Knowledge Definitions (Top):**
* `Q134808 (Vaccine):` biological preparatory medicine that improves immunity to a particular disease.
* `Q38404 (Autism):` neurodevelopmental condition.
* **Claim Deconstruction & Responses:**
* Segment 1 (Yellow): `Autism used to be 1 in 10,000. Now it's 1 in 50.` -> **R1:** Prevalence of autism is not directly supported or refuted.
* Segment 2 (Yellow): `Now, where it all coming from?` -> **R2:** Origin of the increase in autism prevalence is not addressed.
* Segment 3 (Red, underlined): `Vaccines are doing it.` -> **R3:** Statement that vaccines are causing the increase in autism prevalence is directly contradicted by the triplet `[('autism', 'does not have cause', 'vaccine')]`.
#### **Section B: Moon Landing Hoax Claim**
* **Original Claim (Top Center):** "Image shows mismatch between Neil Armstrong’s spacesuit and boot print left on the Moon, therefore Moon landing was a hoax."
* **Traditional Fact-Check (Left):**
* **Source:** Google Fact Check Tools (logo).
* **Verdict:** "AFP Fact Check rating: False".
* **ClaimVer Analysis (Bottom):**
* **Knowledge Definitions (Top):**
* `Q1615 (Neil Armstrong):` American astronaut; first person to walk on the moon.
* `Q495307 (Moon landing):` arrival of a spacecraft on the surface of the Moon.
* **Claim Deconstruction & Responses:**
* Segment 1 (Yellow): `Image shows mismatch between Neil Armstrong’s spacesuit and boot print left on the Moon,` -> **R1:** specific claim about the mismatch between the spacesuit and boot print is not directly supported or refuted.
* Segment 2 (Red, underlined): `therefore Moon landing was a hoax.` -> **R2:** The triplets directly state that the Moon landing was a significant event and an instance of the Apollo 11 mission, which contradicts the claim that the Moon landing was a hoax. `[('Apollo 11', 'crew member(s)', 'Neil Armstrong'), ('Apollo 11','significant event', 'Moon landing'), ('Apollo 11', 'instance of', 'Moon landing')]`.
* **Additional Knowledge Base (Bottom Left):** A cluster of Q-code boxes: `Q223571`, `Q190868`, `Q18218093`, `Q190084`, `Q190084`, `Q405`, `....`.
### Key Observations
1. **Structural Parallelism:** Both sections A and B follow an identical visual and analytical structure, facilitating direct comparison.
2. **Color Coding:** ClaimVer consistently uses yellow text for factual premises or observations and red, underlined text for the core causal or conclusive assertion being evaluated.
3. **Response Hierarchy:** The R1, R2, R3 responses correspond directly to the segmented parts of the claim, moving from peripheral facts to the central assertion.
4. **Knowledge Representation:** ClaimVer relies on a structured knowledge base (Q-codes for entities/concepts and triplets for relationships) to generate its responses, contrasting with the narrative verdicts of the traditional fact-checkers.
5. **Handling of Uncertainty:** In both examples, ClaimVer's R1 response explicitly states when a specific sub-claim (e.g., the prevalence statistic, the image mismatch) is "not directly supported or refuted" by its knowledge base, demonstrating a granular approach to verification.
### Interpretation
This diagram serves as a conceptual model or advertisement for the "ClaimVer" system. It argues that traditional fact-checking provides a binary, holistic verdict (Inaccurate/False), while ClaimVer offers a more nuanced, transparent, and auditable analysis.
The core demonstration is that ClaimVer:
* **Decomposes** complex claims into atomic statements.
* **Contextualizes** key terms using a formal knowledge base (Wikidata-style Q-codes).
* **Evaluates** each component against structured knowledge triplets.
* **Identifies** the precise point of failure in a claim (e.g., the causal link in part A, the conclusion in part B) while acknowledging areas of uncertainty.
The inclusion of the "traditional" fact-check verdicts (from HealthFeedback.org and AFP via Google) likely serves as a benchmark, showing that ClaimVer arrives at the same ultimate conclusion (the claim is false) but through a method that exposes its reasoning chain. The diagram suggests ClaimVer's value lies in its systematic, evidence-linked deconstruction, which could be more resistant to context manipulation and more informative for understanding *why* a claim is wrong. The final cluster of Q-codes in part B hints at the extensive underlying knowledge graph that powers such analysis.
DECODING INTELLIGENCE...