## Line Graphs: Approximation Performance Comparison
### Overview
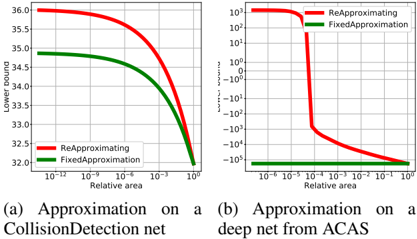
The image contains two line graphs comparing the performance of two approximation methods ("ReApproximating" and "FixedApproximation") across different relative areas. Graph (a) focuses on lower bound values, while graph (b) examines error scores. Both graphs use logarithmic scales on the x-axis (relative area) and linear scales on the y-axis.
### Components/Axes
**Graph (a):**
- **Y-axis (Left):** "Lower bound" (32.0 to 36.0, linear scale)
- **X-axis:** "Relative area" (10⁻¹² to 10⁰, logarithmic scale)
- **Legend:** Top-right corner, labels:
- Red line: "ReApproximating"
- Green line: "FixedApproximation"
**Graph (b):**
- **Y-axis (Left):** "Error score" (-10⁵ to 10³, logarithmic scale)
- **X-axis:** "Relative area" (10⁻⁶ to 10⁰, logarithmic scale)
- **Legend:** Top-right corner, same labels as graph (a)
### Detailed Analysis
**Graph (a):**
- **ReApproximating (Red):** Starts at 36.0 (x=10⁻¹²), decreases smoothly, and intersects the green line at ~10⁻³ relative area. Ends near 32.5 at x=10⁰.
- **FixedApproximation (Green):** Starts at 34.8 (x=10⁻¹²), decreases gradually, and remains below the red line until intersection. Ends near 32.2 at x=10⁰.
**Graph (b):**
- **ReApproximating (Red):** Starts at 10³ (x=10⁻⁶), drops sharply to -10⁵ at x=10⁻³, then stabilizes near -10⁵.
- **FixedApproximation (Green):** Remains constant at -10⁵ across all relative areas.
### Key Observations
1. **Graph (a):**
- ReApproximating begins with a higher lower bound but converges with FixedApproximation as relative area increases.
- Intersection at ~10⁻³ suggests parity in performance at small relative areas.
2. **Graph (b):**
- ReApproximating shows a dramatic error reduction at x=10⁻³, while FixedApproximation maintains a constant low error.
- Red line's sharp decline indicates superior error handling at small relative areas.
### Interpretation
- **Performance Trade-offs:**
- ReApproximating outperforms FixedApproximation at small relative areas (graph b) but starts with a higher lower bound (graph a).
- FixedApproximation offers stability but lacks adaptability at extreme scales.
- **Practical Implications:**
- ReApproximating may be preferable for systems requiring precision at small scales, while FixedApproximation suits scenarios prioritizing consistency.
- **Anomalies:**
- The sharp drop in graph (b) for ReApproximating at x=10⁻³ suggests a threshold effect, warranting further investigation into its underlying mechanism.