## Chart: Approximation Comparison on Neural Networks
### Overview
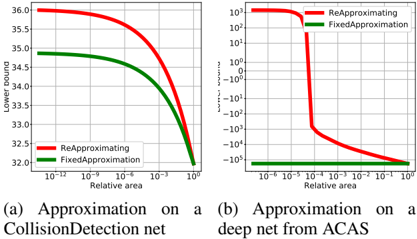
The image contains two line charts comparing the performance of "ReApproximating" and "FixedApproximation" methods on two different neural networks. Chart (a) shows the approximation on a CollisionDetection net, while chart (b) shows the approximation on a deep net from ACAS. The y-axis represents the "Lower bound," and the x-axis represents the "Relative area."
### Components/Axes
**Chart (a): Approximation on a CollisionDetection net**
* **X-axis:** Relative area (logarithmic scale from 10^-12 to 10^0)
* **Y-axis:** Lower bound (linear scale from 32.0 to 36.0)
* **Legend:** Located in the bottom-left corner.
* Red line: ReApproximating
* Green line: FixedApproximation
**Chart (b): Approximation on a deep net from ACAS**
* **X-axis:** Relative area (logarithmic scale from 10^-6 to 10^0)
* **Y-axis:** Lower bound (logarithmic scale from -10^5 to 10^3)
* **Legend:** Located in the top-right corner.
* Red line: ReApproximating
* Green line: FixedApproximation
### Detailed Analysis
**Chart (a): Approximation on a CollisionDetection net**
* **ReApproximating (Red):** The line starts at approximately 36.0 at 10^-12 and gradually decreases to approximately 32.0 at 10^0.
* **FixedApproximation (Green):** The line starts at approximately 34.8 at 10^-12 and gradually decreases to approximately 32.0 at 10^0.
**Chart (b): Approximation on a deep net from ACAS**
* **ReApproximating (Red):** The line starts at approximately 10^3 at 10^-6, drops sharply to approximately -10^5 between 10^-4 and 10^-3, and then gradually increases to approximately -10^5 at 10^0.
* **FixedApproximation (Green):** The line remains constant at approximately -10^5 across the entire range of relative area (10^-6 to 10^0).
### Key Observations
* In Chart (a), both methods show a decrease in the lower bound as the relative area increases. The ReApproximating method consistently has a higher lower bound than the FixedApproximation method.
* In Chart (b), the ReApproximating method shows a significant drop in the lower bound around a relative area of 10^-4 to 10^-3. The FixedApproximation method remains constant.
### Interpretation
The charts compare the performance of two approximation methods on different neural networks. Chart (a) suggests that ReApproximating performs better than FixedApproximation on the CollisionDetection net, as it consistently provides a higher lower bound. Chart (b) indicates that the ReApproximating method is highly sensitive to the relative area on the deep net from ACAS, experiencing a sharp drop in performance. The FixedApproximation method, on the other hand, remains stable but at a significantly lower bound. This suggests that the choice of approximation method depends on the specific neural network and the desired trade-off between stability and performance.