## Chart: Prior Distributions - Dim 8
### Overview
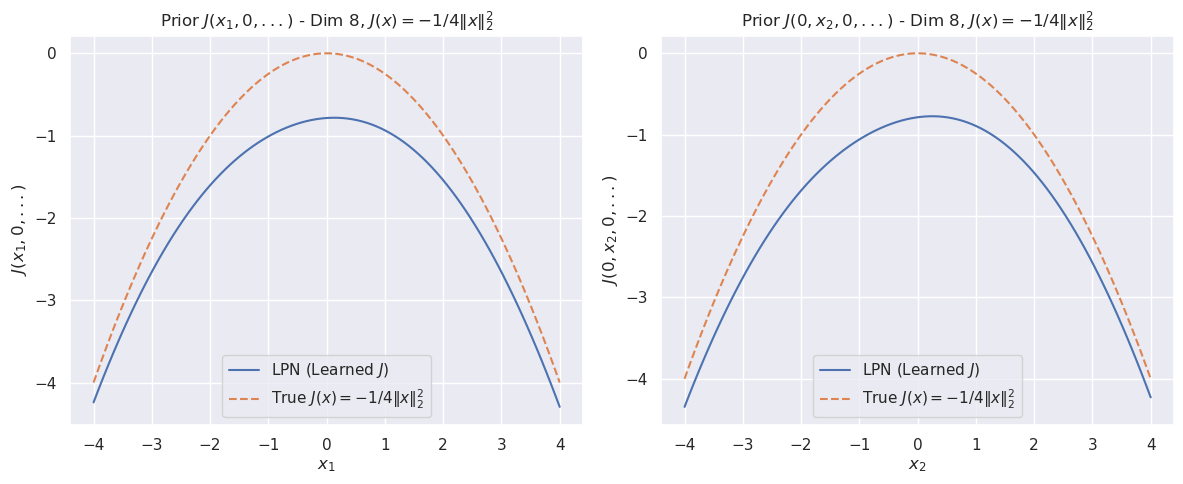
The image presents two identical charts, side-by-side, visualizing prior distributions for a function *J(x)* in 8 dimensions. Both charts depict the function's value against a single variable (x1 in the left chart, x2 in the right chart), while holding other dimensions constant. The charts compare a "True" function *J(x) = -1/4||x||²* with a "Learned" function, represented by LPN (Likelihood Product Network). Both charts share the same scales and legends.
### Components/Axes
* **Title:** "Prior *J(x1, x2, 0,...)* - Dim 8, *J(x) = -1/4||x||²*" (appears on both charts)
* **X-axis:** Labeled "x1" (left chart) and "x2" (right chart), ranging from approximately -4 to 4.
* **Y-axis:** Labeled "*J(x1, x2, 0,...)*" (left chart) and "*J(0, x2, 0,...)*" (right chart), ranging from approximately -4.5 to 0.
* **Legend:** Located in the bottom-left corner of each chart.
* "LPN (Learned *J*)" - Represented by a solid blue line.
* "True *J(x) = -1/4||x||²*" - Represented by a dashed orange line.
### Detailed Analysis
**Left Chart (x1):**
* **True Function (Orange Dashed Line):** This line forms a parabolic curve, opening upwards. The minimum value is approximately -4 at x1 = 0. The curve is symmetrical around x1 = 0.
* **LPN (Learned) Function (Blue Solid Line):** This line also forms a parabolic curve, opening upwards. The minimum value is approximately -3.8 at x1 = 0. The curve is symmetrical around x1 = 0. The LPN curve is slightly flatter than the True function curve.
* **Data Points (LPN):** The blue line shows significant variance, indicated by the shaded area around the line. The variance is highest at the extremes of the x1 axis (approximately x1 = -4 and x1 = 4) and decreases towards the center (x1 = 0).
**Right Chart (x2):**
* **True Function (Orange Dashed Line):** Identical to the left chart, this line forms a parabolic curve, opening upwards. The minimum value is approximately -4 at x2 = 0. The curve is symmetrical around x2 = 0.
* **LPN (Learned) Function (Blue Solid Line):** Identical to the left chart, this line also forms a parabolic curve, opening upwards. The minimum value is approximately -3.8 at x2 = 0. The curve is symmetrical around x2 = 0. The LPN curve is slightly flatter than the True function curve.
* **Data Points (LPN):** The blue line shows significant variance, indicated by the shaded area around the line. The variance is highest at the extremes of the x2 axis (approximately x2 = -4 and x2 = 4) and decreases towards the center (x2 = 0).
### Key Observations
* Both charts exhibit a similar pattern: the LPN-learned function closely approximates the true function, but is slightly flatter.
* The LPN function has a higher minimum value than the true function in both charts.
* The variance of the LPN function is highest at the extremes of the x-axis and lowest at the center. This suggests that the LPN is more uncertain about the function's value when the input variable is far from zero.
* The charts are nearly identical, indicating that the learned function is consistent across different dimensions (x1 and x2).
### Interpretation
The charts demonstrate the performance of a Likelihood Product Network (LPN) in learning a prior distribution for a function *J(x)*. The LPN successfully approximates the true function *J(x) = -1/4||x||²*, but with some degree of error and uncertainty. The flatter shape of the LPN curve suggests that the LPN may be underestimating the curvature of the true function. The higher variance at the extremes of the x-axis indicates that the LPN is less confident in its predictions when the input variable is far from zero. This could be due to a lack of training data in those regions, or to the inherent limitations of the LPN model. The consistency between the two charts suggests that the LPN is learning a relatively isotropic prior distribution, meaning that the uncertainty is similar in all directions. The charts provide valuable insights into the LPN's ability to learn and represent complex functions, and highlight areas where further improvement may be needed.