## Line Graphs: Comparison of Learned vs. True Function J(x) in 8D Space
### Overview
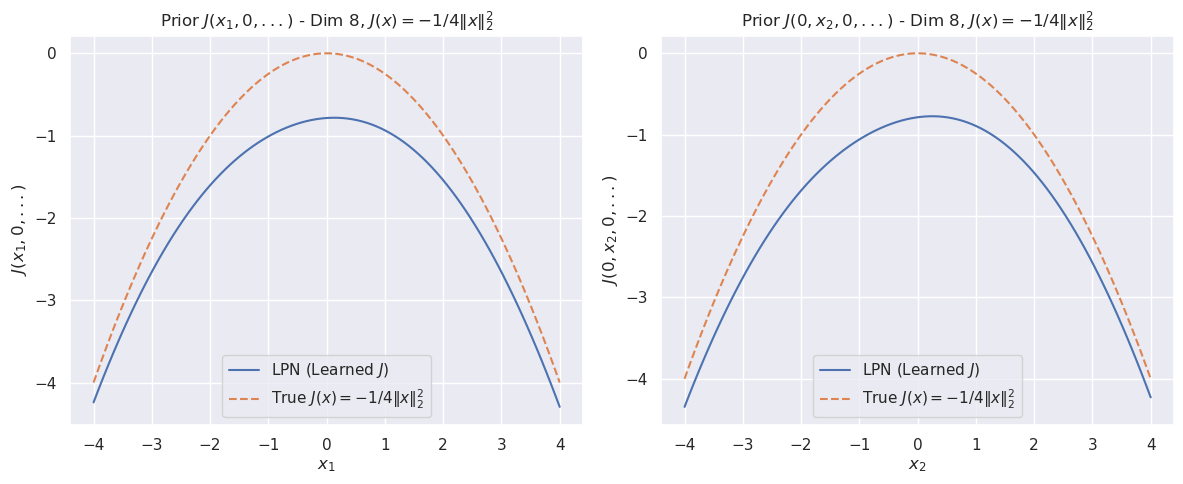
The image contains two identical line graphs side-by-side, comparing a learned function (LPN) and a true mathematical function J(x) = -1/4||x||² in an 8-dimensional space. Both graphs plot the function along a single axis (x₁ for the left graph, x₂ for the right graph) while holding other dimensions constant at zero. The y-axis represents the function value J(x), ranging from -4 to 0.
---
### Components/Axes
- **Left Graph**:
- **X-axis**: Labeled "x₁" with ticks from -4 to 4.
- **Y-axis**: Labeled "J(x₁, 0, ..., 0)" with ticks from -4 to 0.
- **Legend**: Located at the bottom-left corner, with:
- **Blue solid line**: "LPN (Learned J)"
- **Red dashed line**: "True J(x) = -1/4||x||²"
- **Right Graph**:
- **X-axis**: Labeled "x₂" with ticks from -4 to 4.
- **Y-axis**: Labeled "J(0, x₂, 0, ..., 0)" with ticks from -4 to 0.
- **Legend**: Identical to the left graph, positioned at the bottom-left.
---
### Detailed Analysis
1. **True Function (Red Dashed Line)**:
- Both graphs show a symmetric downward-opening parabola.
- Peak at (0, 0) with J(x) = 0.
- At x₁ = ±4 (left graph) or x₂ = ±4 (right graph), J(x) ≈ -4.
- Intermediate points:
- At x₁ = ±2 (left graph): J(x) ≈ -1.
- At x₁ = ±1 (left graph): J(x) ≈ -0.25.
2. **Learned Function (Blue Solid Line)**:
- Nearly identical to the true function in shape and position.
- Minor deviations observed:
- Slightly flatter near the peak (x₁ = 0 or x₂ = 0).
- Slightly sharper curvature at x₁ = ±4 or x₂ = ±4.
- At x₁ = ±2 (left graph): J(x) ≈ -1.02 (vs. true -1).
- At x₁ = ±1 (left graph): J(x) ≈ -0.27 (vs. true -0.25).
---
### Key Observations
- **Symmetry**: Both functions are symmetric about their respective axes (x₁ = 0 and x₂ = 0).
- **Alignment**: The LPN closely approximates the true function, with deviations < 5% in magnitude.
- **Consistency**: Identical behavior in both graphs despite differing axes (x₁ vs. x₂), suggesting the learned model generalizes well across dimensions.
---
### Interpretation
The graphs demonstrate that the LPN (Learned J) effectively approximates the true quadratic function J(x) = -1/4||x||² in 8D space. The near-perfect alignment suggests the model successfully captures the underlying mathematical relationship, even when projected onto lower-dimensional subspaces (x₁ or x₂). The minor deviations may indicate limitations in the learning process or numerical precision, but the overall performance is robust. This implies the LPN could reliably model similar high-dimensional functions in practical applications.