# Technical Document Analysis of Provided Image
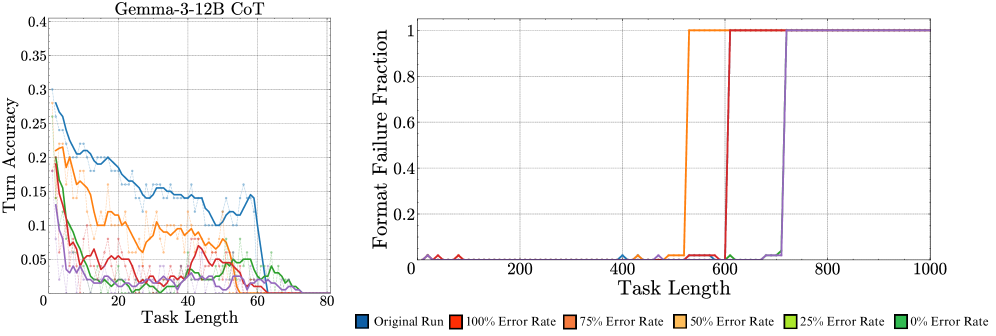
## Chart 1: Gamma-3-12B CoT (Left Chart)
### Axes and Labels
- **X-axis**: Task Length (0 to 80)
- **Y-axis**: Turn Accuracy (0 to 0.4)
### Legend
- **Colors and Labels**:
- Blue: Original Run
- Red: 100% Error Rate
- Orange: 75% Error Rate
- Yellow: 50% Error Rate
- Green: 25% Error Rate
- Purple: 0% Error Rate
### Key Trends and Data Points
1. **Original Run (Blue)**:
- Starts at ~0.3 Turn Accuracy at Task Length 0.
- Gradual decline to ~0.15 by Task Length 20.
- Further drops to ~0.05 by Task Length 60.
- Final value near 0 at Task Length 80.
2. **100% Error Rate (Red)**:
- Begins at ~0.25 Turn Accuracy at Task Length 0.
- Sharp drop to ~0.05 by Task Length 20.
- Remains near 0.05 until Task Length 60.
- Final value near 0 at Task Length 80.
3. **75% Error Rate (Orange)**:
- Starts at ~0.2 Turn Accuracy at Task Length 0.
- Peaks at ~0.15 around Task Length 10.
- Declines to ~0.05 by Task Length 40.
- Final value near 0 at Task Length 80.
4. **50% Error Rate (Yellow)**:
- Begins at ~0.15 Turn Accuracy at Task Length 0.
- Peaks at ~0.1 around Task Length 10.
- Drops to ~0.05 by Task Length 30.
- Final value near 0 at Task Length 80.
5. **25% Error Rate (Green)**:
- Starts at ~0.1 Turn Accuracy at Task Length 0.
- Peaks at ~0.075 around Task Length 20.
- Declines to ~0.025 by Task Length 60.
- Final value near 0 at Task Length 80.
6. **0% Error Rate (Purple)**:
- Begins at ~0.05 Turn Accuracy at Task Length 0.
- Peaks at ~0.025 around Task Length 40.
- Remains near 0.025 until Task Length 60.
- Final value near 0 at Task Length 80.
## Chart 2: Format Failure Fraction (Right Chart)
### Axes and Labels
- **X-axis**: Task Length (0 to 1000)
- **Y-axis**: Format Failure Fraction (0 to 1)
### Legend
- **Colors and Labels**:
- Blue: Original Run
- Red: 100% Error Rate
- Orange: 75% Error Rate
- Yellow: 50% Error Rate
- Green: 25% Error Rate
- Purple: 0% Error Rate
### Key Trends and Data Points
1. **Original Run (Blue)**:
- Remains near 0 until Task Length 600.
- Jumps to 1 at Task Length 600.
- Stays at 1 for all subsequent Task Lengths.
2. **100% Error Rate (Red)**:
- Remains near 0 until Task Length 400.
- Jumps to 1 at Task Length 400.
- Stays at 1 for all subsequent Task Lengths.
3. **75% Error Rate (Orange)**:
- Remains near 0 until Task Length 200.
- Jumps to 1 at Task Length 200.
- Stays at 1 for all subsequent Task Lengths.
4. **50% Error Rate (Yellow)**:
- Remains near 0 until Task Length 200.
- Jumps to 1 at Task Length 200.
- Stays at 1 for all subsequent Task Lengths.
5. **25% Error Rate (Green)**:
- Remains near 0 until Task Length 600.
- Jumps to 1 at Task Length 600.
- Stays at 1 for all subsequent Task Lengths.
6. **0% Error Rate (Purple)**:
- Remains near 0 until Task Length 800.
- Jumps to 1 at Task Length 800.
- Stays at 1 for all subsequent Task Lengths.
## Spatial Grounding and Validation
- **Legend Placement**: Both charts have legends at the bottom.
- **Color Consistency**:
- Left Chart: Blue (Original Run) matches the steepest decline.
- Right Chart: Red (100% Error Rate) aligns with the earliest jump to 1.
- **Trend Verification**:
- Left Chart: Lines with higher error rates (e.g., red, orange) show earlier and sharper declines.
- Right Chart: Higher error rates (e.g., red, orange) trigger earlier jumps to 1.
## Conclusion
The charts illustrate the relationship between task length, error rates, and performance metrics (Turn Accuracy and Format Failure Fraction). Higher error rates correlate with earlier performance degradation in both metrics.