## Line Chart: Benchmark Performance vs. Number of Failed LLMs
### Overview
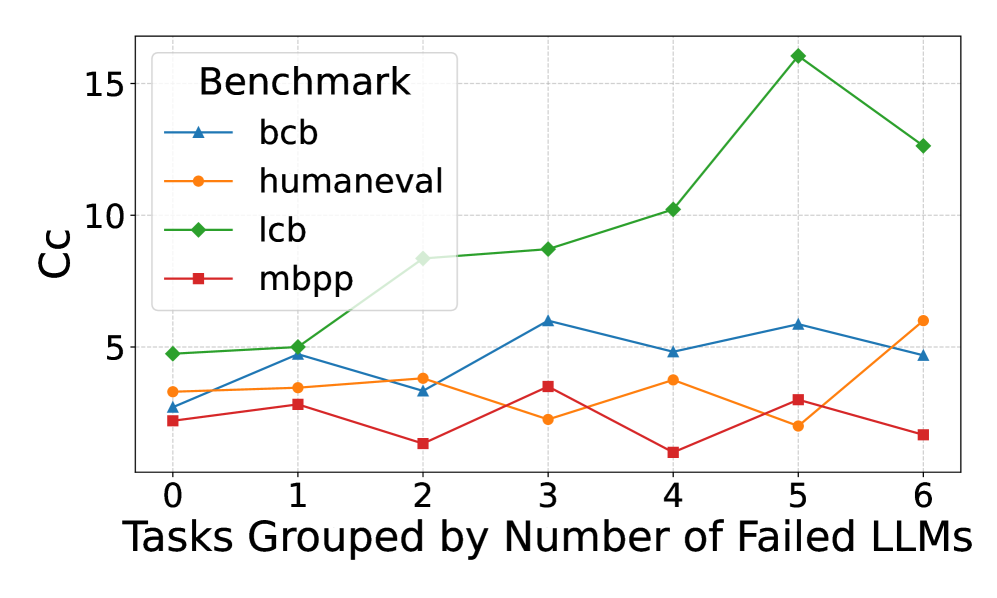
The image is a line chart comparing the performance of four benchmarks (bcb, humaneval, lcb, and mbpp) against the number of failed Large Language Models (LLMs). The x-axis represents the number of failed LLMs, ranging from 0 to 6. The y-axis represents the "Cc" score, presumably a performance metric, ranging from 0 to 15. Each benchmark is represented by a different colored line with a distinct marker.
### Components/Axes
* **Title:** None explicitly present in the image.
* **X-axis:** "Tasks Grouped by Number of Failed LLMs" with tick marks at 0, 1, 2, 3, 4, 5, and 6.
* **Y-axis:** "Cc" with tick marks at 5, 10, and 15.
* **Legend:** Located in the top-left corner, labeled "Benchmark". It identifies the lines as follows:
* Blue line with triangle markers: "bcb"
* Orange line with circle markers: "humaneval"
* Green line with diamond markers: "lcb"
* Red line with square markers: "mbpp"
### Detailed Analysis
* **bcb (Blue, Triangle):** Starts at approximately 3 Cc with 0 failed LLMs, rises to approximately 5 Cc at 3 failed LLMs, dips to approximately 4.8 Cc at 4 failed LLMs, rises slightly to approximately 5.5 Cc at 5 failed LLMs, and ends at approximately 4.5 Cc at 6 failed LLMs.
* **humaneval (Orange, Circle):** Starts at approximately 3.5 Cc with 0 failed LLMs, rises slightly to approximately 3.8 Cc at 1 failed LLMs, remains relatively flat at approximately 3.7 Cc at 2 failed LLMs, dips to approximately 2.5 Cc at 3 failed LLMs, rises to approximately 4 Cc at 4 failed LLMs, dips to approximately 2.5 Cc at 5 failed LLMs, and rises to approximately 6 Cc at 6 failed LLMs.
* **lcb (Green, Diamond):** Starts at approximately 4.8 Cc with 0 failed LLMs, rises slightly to approximately 5 Cc at 1 failed LLMs, rises to approximately 8.5 Cc at 2 failed LLMs, rises slightly to approximately 9 Cc at 3 failed LLMs, rises to approximately 10.2 Cc at 4 failed LLMs, rises sharply to approximately 15.8 Cc at 5 failed LLMs, and drops to approximately 12.5 Cc at 6 failed LLMs.
* **mbpp (Red, Square):** Starts at approximately 2.2 Cc with 0 failed LLMs, rises slightly to approximately 3.5 Cc at 1 failed LLMs, dips to approximately 1 Cc at 2 failed LLMs, rises to approximately 3.5 Cc at 3 failed LLMs, dips to approximately 0.8 Cc at 4 failed LLMs, rises to approximately 3 Cc at 5 failed LLMs, and dips to approximately 1.5 Cc at 6 failed LLMs.
### Key Observations
* The "lcb" benchmark shows the most significant increase in "Cc" score as the number of failed LLMs increases, peaking at 5 failed LLMs.
* The "mbpp" benchmark shows the most fluctuation, with no clear trend.
* The "humaneval" benchmark remains relatively stable, with a slight increase at 6 failed LLMs.
* The "bcb" benchmark shows a slight increase and then a decrease as the number of failed LLMs increases.
### Interpretation
The chart suggests that the performance of different benchmarks varies significantly as the number of failed LLMs increases. The "lcb" benchmark appears to be the most sensitive to the number of failed LLMs, showing a strong positive correlation up to 5 failed LLMs. The other benchmarks show less pronounced or more erratic trends. This could indicate that the "lcb" benchmark is more challenging or better at exposing the limitations of LLMs. The "Cc" score likely represents a measure of accuracy or correctness, and the increase in "Cc" for "lcb" might indicate that the tasks become easier to solve as more LLMs fail, possibly due to a change in the nature of the tasks being solved. The fluctuations in "mbpp" could indicate that its performance is less dependent on the number of failed LLMs or that the benchmark is inherently noisy.