## Line Graph: Benchmark Performance by Task Group
### Overview
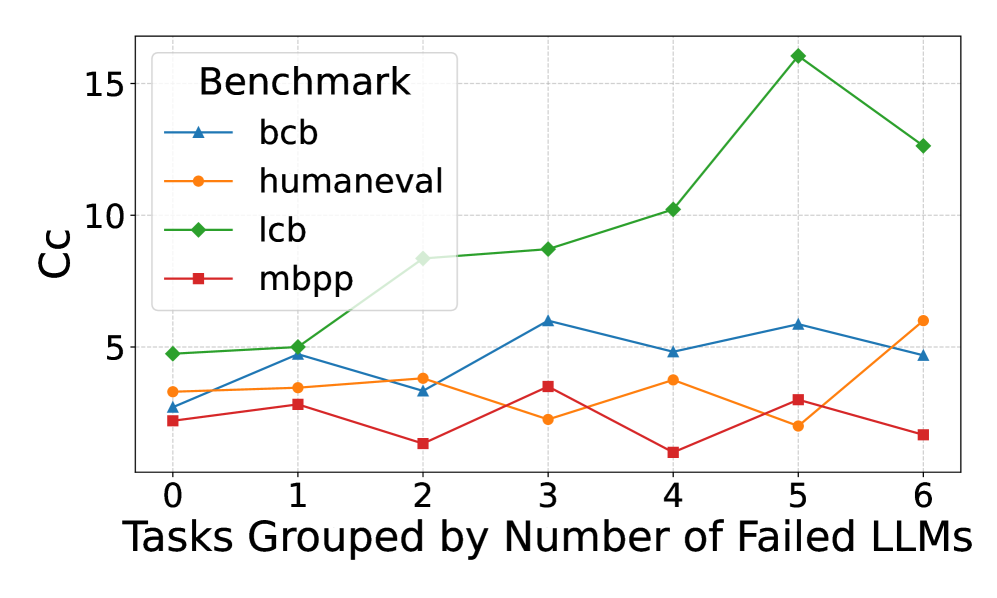
The image is a line graph comparing four benchmarks (bcb, humaneval, lcb, mbpp) across task groups categorized by the number of failed LLMs (0–6). The y-axis measures "Cc" (likely a metric like correctness or complexity), while the x-axis groups tasks by failure counts. The green line (lcb) dominates with a sharp peak, while others show moderate fluctuations.
### Components/Axes
- **X-axis**: "Tasks Grouped by Number of Failed LLMs" (0–6, integer intervals).
- **Y-axis**: "Cc" (scale 0–15, linear).
- **Legend**: Top-left corner, mapping colors to benchmarks:
- Blue triangle: bcb
- Orange circle: humaneval
- Green diamond: lcb
- Red square: mbpp
### Detailed Analysis
1. **lcb (Green Diamond Line)**:
- Starts at ~5 (x=0), rises to ~16 (x=5), then drops to ~13 (x=6).
- Sharp peak at x=5 suggests a task group with high Cc values when 5 LLMs failed.
2. **bcb (Blue Triangle Line)**:
- Fluctuates between ~3 (x=0) and ~6 (x=3, x=5).
- Relatively stable with minor peaks.
3. **humaneval (Orange Circle Line)**:
- Ranges from ~2 (x=3, x=5) to ~6 (x=6).
- Gradual increase toward x=6.
4. **mbpp (Red Square Line)**:
- Stays between ~1 (x=4) and ~4 (x=1, x=5).
- Lowest values at x=4 and x=2.
### Key Observations
- **lcb** exhibits extreme variability, with a 11-point spike at x=5.
- **mbpp** consistently underperforms compared to other benchmarks.
- **bcb** and **humaneval** show moderate, overlapping performance.
- No data points exceed 15 on the y-axis.
### Interpretation
The data suggests that the **lcb** benchmark is highly sensitive to task group composition, particularly when 5 LLMs fail (x=5), where it reaches its maximum Cc value. This could indicate a critical threshold where task difficulty or failure rates disproportionately impact performance. In contrast, **mbpp** remains consistently low, implying it may measure simpler or more constrained tasks. The stability of **bcb** and **humaneval** suggests they are less affected by task group variability. The peak at x=5 for lcb warrants further investigation into whether specific task characteristics or failure patterns drive this anomaly.