# Technical Document Extraction: Layer-wise Norm Analysis
## 1. Image Overview
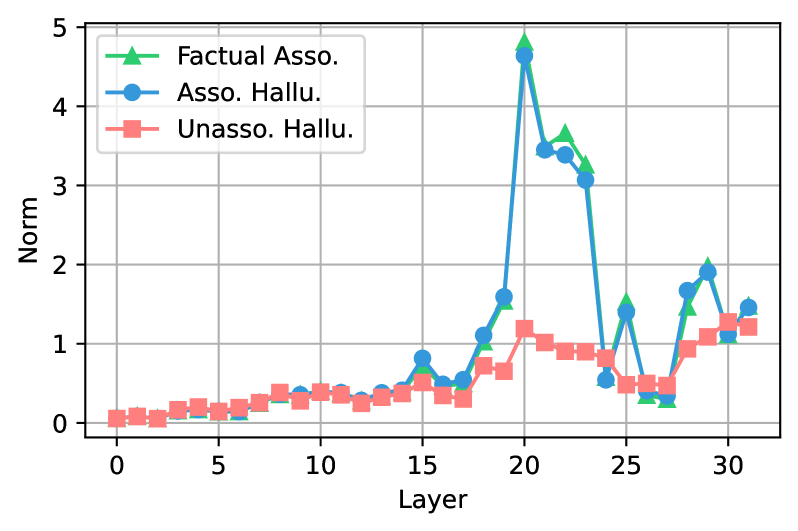
This image is a line graph plotting a metric labeled **"Norm"** against **"Layer"** indices for a neural network model (likely a Large Language Model given the 32-layer architecture). The chart compares three distinct categories of data generation or association.
## 2. Component Isolation
### Header/Legend
* **Location:** Top-left quadrant of the plot area.
* **Legend Items:**
1. **Factual Asso.** (Green line, Triangle markers `▲`): Represents factual associations.
2. **Asso. Hallu.** (Blue line, Circle markers `●`): Represents associative hallucinations.
3. **Unasso. Hallu.** (Pink/Light Red line, Square markers `■`): Represents unassociated hallucinations.
### Main Chart Area
* **X-Axis:** Labeled **"Layer"**. Numerical markers range from 0 to 30 with increments of 5 (0, 5, 10, 15, 20, 25, 30). The data points extend to layer 31.
* **Y-Axis:** Labeled **"Norm"**. Numerical markers range from 0 to 5 with increments of 1 (0, 1, 2, 3, 4, 5).
* **Grid:** A major grid is present for both X and Y axes.
---
## 3. Trend Verification and Data Extraction
### Series 1: Factual Asso. (Green, Triangle `▲`)
* **Visual Trend:** Remains very low and stable (near 0) from Layer 0 to 14. It shows a slight bump at Layer 15, then a massive, sharp spike peaking at Layer 20. It remains high but volatile through Layer 23, drops sharply at Layer 24, and exhibits secondary peaks at Layers 25 and 29.
* **Key Data Points (Approximate):**
* Layers 0–14: ~0.1 to 0.4
* Layer 15: ~0.8
* Layer 20: **~4.8 (Global Maximum)**
* Layer 22: ~3.7
* Layer 24: ~0.6
* Layer 29: ~2.0
### Series 2: Asso. Hallu. (Blue, Circle `●`)
* **Visual Trend:** This series tracks almost identically to the "Factual Asso." series. It stays low until Layer 14, spikes in tandem at Layer 20, and follows the same volatile pattern in the later layers.
* **Key Data Points (Approximate):**
* Layers 0–14: ~0.1 to 0.4
* Layer 15: ~0.8
* Layer 20: **~4.7 (Slightly lower than Factual)**
* Layer 22: ~3.4
* Layer 24: ~0.55
* Layer 29: ~1.9
### Series 3: Unasso. Hallu. (Pink, Square `■`)
* **Visual Trend:** This series is significantly more stable than the other two. It follows the same baseline from Layer 0 to 18. While it shows a small increase at Layer 20, it does not participate in the massive spike seen in the "Associated" categories. It maintains a relatively flat profile between 0.5 and 1.3 for the remainder of the layers.
* **Key Data Points (Approximate):**
* Layers 0–18: ~0.1 to 0.7
* Layer 20: ~1.2 (Local peak, but much lower than others)
* Layers 21–28: Fluctuates between 0.5 and 1.0
* Layer 31: ~1.2
---
## 4. Comparative Analysis and Observations
* **Correlation:** There is an extremely high correlation between "Factual Asso." and "Asso. Hallu." across all 32 layers. This suggests that the mechanism driving factual retrieval and associative hallucination is localized in the same layers (specifically layers 19–23 and 28–30).
* **Divergence:** The "Unasso. Hallu." category diverges sharply from the other two starting at Layer 19. While the "Associated" norms skyrocket, the "Unassociated" norm remains suppressed.
* **Critical Layer:** **Layer 20** is the most significant point of activity for associated content, reaching a Norm value nearly 5x higher than the baseline.
* **Architecture:** The 0-31 layer range is characteristic of a 32-layer transformer model (e.g., Llama-2-7B or similar).