\n
## Line Chart: Norm vs. Layer for Association Types
### Overview
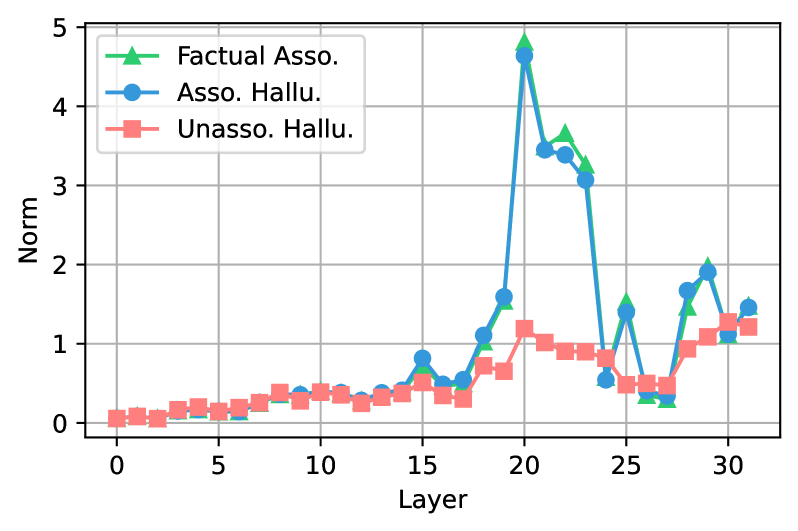
The image presents a line chart illustrating the relationship between "Layer" (x-axis) and "Norm" (y-axis) for three different types of associations: "Factual Association", "Association Hallucination", and "Unassociation Hallucination". The chart displays the normalized values of these associations across layers, presumably within a neural network or similar layered system.
### Components/Axes
* **X-axis:** "Layer", ranging from 0 to approximately 32. The axis is linearly scaled with markers at intervals of 5.
* **Y-axis:** "Norm", ranging from 0 to 5. The axis is linearly scaled with markers at intervals of 1.
* **Legend:** Located in the top-left corner of the chart.
* "Factual Asso." (represented by a green triangle marker)
* "Asso. Hallu." (represented by a blue circle marker)
* "Unasso. Hallu." (represented by a red square marker)
* **Gridlines:** Present to aid in reading values.
### Detailed Analysis
The chart contains three distinct lines, each representing one of the association types.
* **Factual Asso. (Green):** The line starts at approximately 0.2 at Layer 0, remains relatively flat until around Layer 18, then increases sharply to a peak of approximately 4.2 at Layer 20. It then declines to around 0.7 at Layer 24, and fluctuates between 0.7 and 1.8 until Layer 32, ending at approximately 1.7.
* **Asso. Hallu. (Blue):** This line begins at approximately 0.1 at Layer 0 and remains low until around Layer 18, where it begins to rise. It peaks sharply at approximately 4.5 at Layer 20, then rapidly decreases to around 0.5 at Layer 24. It then fluctuates between 0.5 and 1.5 until Layer 32, ending at approximately 1.2.
* **Unasso. Hallu. (Red):** This line starts at approximately 0.05 at Layer 0 and gradually increases to around 0.6 at Layer 18. It continues to rise, peaking at approximately 1.2 at Layer 20, then declines to around 0.8 at Layer 24. It fluctuates between 0.8 and 1.3 until Layer 32, ending at approximately 1.1.
### Key Observations
* Both "Factual Asso." and "Asso. Hallu." exhibit a significant peak around Layer 20, suggesting a critical point in the network where these associations are most pronounced.
* "Asso. Hallu." consistently shows higher normalized values than "Factual Asso." around the peak at Layer 20, indicating a stronger presence of association hallucinations at that layer.
* "Unasso. Hallu." remains consistently lower than the other two association types throughout the entire range of layers.
* All three lines show a general increase in "Norm" values as the "Layer" number increases, up to the peak around Layer 20, followed by a decline and subsequent fluctuation.
### Interpretation
The data suggests that Layer 20 is a critical layer within the system being analyzed, where both factual associations and association hallucinations reach their highest levels. The higher normalized values for "Asso. Hallu." at this layer indicate that the system is prone to generating incorrect associations at this point. The relatively low values for "Unasso. Hallu." suggest that the system is less likely to generate hallucinations that are completely unrelated to the input.
The increasing trend in all three association types up to Layer 20 could indicate that the network is learning and forming more connections as it progresses through the layers. The subsequent decline after Layer 20 might suggest that the network is starting to refine its associations and reduce the number of hallucinations, or that the signal is being lost.
The fluctuations in the lines after Layer 20 could be due to noise in the data, or they could represent more subtle changes in the network's behavior. Further investigation would be needed to determine the exact cause of these fluctuations. The chart provides a valuable insight into the behavior of the system and could be used to identify areas for improvement.