TECHNICAL ASSET FINGERPRINT
80837cdc2bc485b6ed67dc0c
Click to view fullscreen
Press ESC or click to close
FOUND IN PAPERS
EXPERT: healer-alpha-free VERSION 1
RUNTIME: free/openrouter/healer-alpha
INTEL_VERIFIED
## Line Chart: Norm Values Across Layers for Three Association/Hallucination Types
### Overview
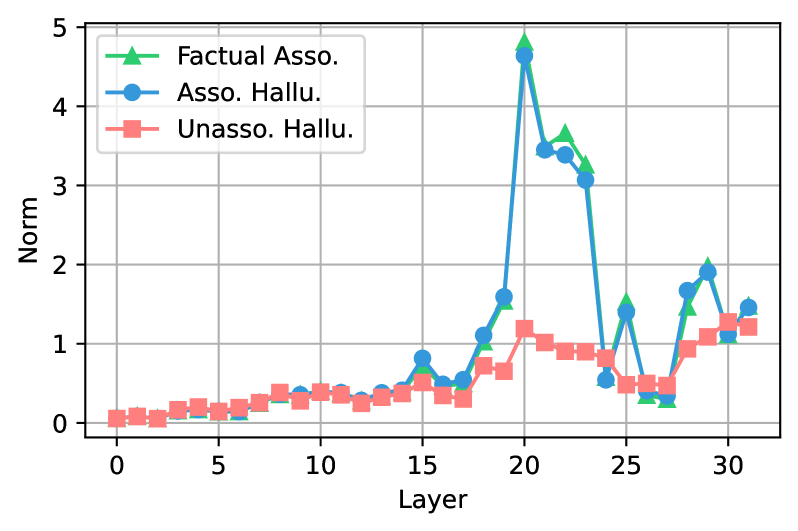
This is a line chart plotting a metric called "Norm" on the vertical y-axis against "Layer" on the horizontal x-axis. It compares three distinct data series over a range of layers from 0 to approximately 31. The chart shows that two of the series exhibit a dramatic, synchronized spike around layer 20, while the third remains relatively low and stable.
### Components/Axes
* **Chart Type:** Line chart with markers.
* **X-Axis:**
* **Label:** "Layer"
* **Scale:** Linear, from 0 to 30, with major tick marks every 5 units (0, 5, 10, 15, 20, 25, 30). Data points appear to be plotted for every integer layer from 0 to 31.
* **Y-Axis:**
* **Label:** "Norm"
* **Scale:** Linear, from 0 to 5, with major tick marks every 1 unit (0, 1, 2, 3, 4, 5).
* **Legend:** Located in the **top-left corner** of the plot area. It defines three series:
1. **Factual Asso.** - Represented by a **green line with upward-pointing triangle markers**.
2. **Asso. Hallu.** - Represented by a **blue line with circle markers**.
3. **Unasso. Hallu.** - Represented by a **red (salmon/pink) line with square markers**.
* **Grid:** A light gray grid is present, aiding in value estimation.
### Detailed Analysis
**1. Factual Asso. (Green Triangle Line):**
* **Trend:** Starts near zero, shows a very gradual, shallow increase from layer 0 to ~15. Experiences a sharp, dramatic increase beginning around layer 17, peaking at its maximum value. Following the peak, it declines sharply, then exhibits volatile fluctuations with secondary peaks.
* **Key Data Points (Approximate):**
* Layers 0-15: Norm value slowly rises from ~0.05 to ~0.7.
* Layer 17: ~1.0
* Layer 18: ~1.6
* **Layer 20 (Peak): ~4.8**
* Layer 21: ~3.5
* Layer 22: ~3.6
* Layer 23: ~3.1
* Layer 24: ~0.6 (sharp drop)
* Layer 25: ~1.5
* Layer 26: ~0.3
* Layer 27: ~0.3
* Layer 28: ~1.5
* **Layer 29 (Secondary Peak): ~2.0**
* Layer 30: ~1.1
* Layer 31: ~1.5
**2. Asso. Hallu. (Blue Circle Line):**
* **Trend:** Closely mirrors the "Factual Asso." line in shape and timing, particularly during the major spike. Its values are generally slightly lower than the green line at corresponding points, especially at the peak and in the later fluctuations.
* **Key Data Points (Approximate):**
* Layers 0-15: Tracks very closely with the green line, from ~0.05 to ~0.8.
* Layer 17: ~1.1
* Layer 18: ~1.6
* **Layer 20 (Peak): ~4.6**
* Layer 21: ~3.4
* Layer 22: ~3.4
* Layer 23: ~3.1
* Layer 24: ~0.5
* Layer 25: ~1.4
* Layer 26: ~0.5
* Layer 27: ~0.5
* Layer 28: ~1.7
* Layer 29: ~1.9
* Layer 30: ~1.1
* Layer 31: ~1.5
**3. Unasso. Hallu. (Red Square Line):**
* **Trend:** Shows a much more subdued pattern. It has a very gradual, low-amplitude increase from layer 0, with a modest peak around layer 20, followed by a slight decline and then a gentle rise again towards the end. It never exhibits the dramatic spikes seen in the other two series.
* **Key Data Points (Approximate):**
* Layers 0-15: Very slow rise from ~0.05 to ~0.5.
* Layer 17: ~0.5
* Layer 18: ~0.7
* **Layer 20 (Peak): ~1.2**
* Layer 21: ~1.0
* Layer 22: ~0.9
* Layer 23: ~0.9
* Layer 24: ~0.8
* Layer 25: ~0.5
* Layer 26: ~0.5
* Layer 27: ~0.5
* Layer 28: ~0.9
* Layer 29: ~1.0
* Layer 30: ~1.3
* Layer 31: ~1.2
### Key Observations
1. **Synchronized Spike:** The most prominent feature is the massive, synchronized spike in both "Factual Asso." and "Asso. Hallu." at **Layer 20**. Their values jump from ~1.6 to over 4.5 within 2-3 layers.
2. **Strong Correlation:** The green and blue lines are highly correlated in their movement, suggesting a strong relationship between "Factual Association" and "Associated Hallucination" metrics across layers.
3. **Divergence Post-Peak:** After the major spike (post-layer 23), the correlation weakens. The green line ("Factual Asso.") shows more extreme volatility, with deeper troughs and higher secondary peaks compared to the blue line.
4. **Baseline Difference:** The "Unasso. Hallu." (red) series operates on a fundamentally different scale, remaining below a Norm of 1.5 throughout, while the other two exceed 4.5 at their peak.
5. **Layer Sensitivity:** The system or model being measured appears to have a critical processing stage or transformation occurring around **Layer 20**, which dramatically amplifies the measured "Norm" for factual and associated hallucination content.
### Interpretation
This chart likely visualizes internal metrics from a neural network or language model, where "Layer" refers to the depth within the model's architecture. The "Norm" could represent the magnitude of activations, attention weights, or some other internal representation strength.
* **What the data suggests:** The data strongly indicates that the model's processing of factual associations and hallucinations that are associated with those facts are deeply intertwined and undergo a significant, amplified transformation at a specific depth (Layer 20). This could be a layer where high-level semantic integration or reasoning occurs.
* **Relationship between elements:** The near-identical trajectory of "Factual Asso." and "Asso. Hallu." implies that the mechanisms generating associated hallucinations are closely linked to, or perhaps a byproduct of, the same processes that handle factual associations. The "Unasso. Hallu." series, being decorrelated and lower magnitude, may represent a different, more baseline error mode.
* **Notable anomalies:** The extreme volatility after Layer 20, especially in the factual association metric, is notable. It suggests that after this critical processing point, the model's internal state becomes less stable or more sensitive, leading to large fluctuations in the measured norm. The secondary peak around Layer 29 might indicate another, less intense processing stage.
**In summary, the chart reveals a model architecture with a highly active and potentially critical processing hub around Layer 20, where factual and associated hallucination signals are massively amplified in a correlated manner, followed by a period of increased volatility.**
DECODING INTELLIGENCE...