## Line Graph: Normalized Metrics Across Layers
### Overview
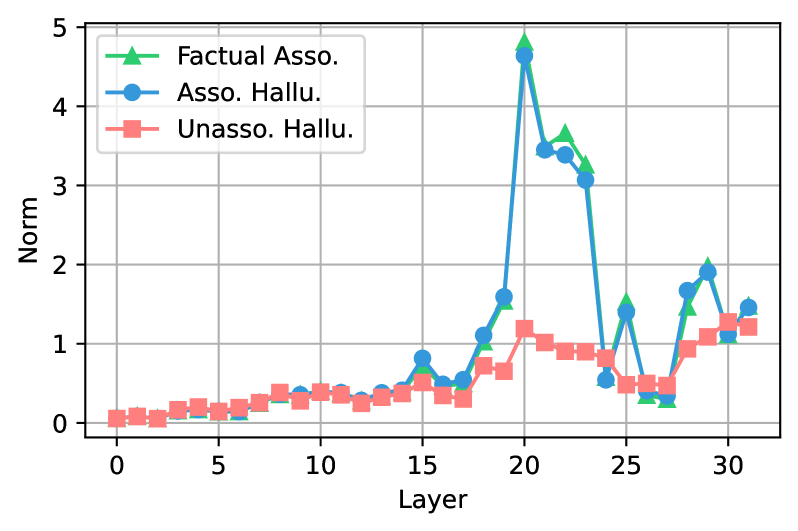
The image depicts a line graph comparing three normalized metrics across 30 layers: **Factual Association** (green triangles), **Associated Hallucination** (blue circles), and **Unassociated Hallucination** (red squares). The y-axis represents normalized values (0–5), and the x-axis represents layers (0–30). All three metrics exhibit distinct trends, with notable peaks and fluctuations.
---
### Components/Axes
- **X-axis (Layer)**: Ranges from 0 to 30, labeled "Layer."
- **Y-axis (Norm)**: Normalized values from 0 to 5, labeled "Norm."
- **Legend**: Located in the top-left corner, with three entries:
- Green triangles: **Factual Association**
- Blue circles: **Associated Hallucination**
- Red squares: **Unassociated Hallucination**
---
### Detailed Analysis
#### Factual Association (Green Triangles)
- **Trend**: Starts near 0 at layer 0, gradually increases to a peak of ~4.8 at layer 20, then declines to ~0.2 at layer 25, and rises again to ~1.8 by layer 30.
- **Key Points**:
- Layer 20: Peak (~4.8)
- Layer 25: Trough (~0.2)
- Layer 30: ~1.8
#### Associated Hallucination (Blue Circles)
- **Trend**: Remains near 0 until layer 15, spikes to ~4.6 at layer 20, drops sharply to ~0.5 at layer 25, and fluctuates between 0.5–1.5 by layer 30.
- **Key Points**:
- Layer 20: Peak (~4.6)
- Layer 25: Trough (~0.5)
- Layer 30: ~1.5
#### Unassociated Hallucination (Red Squares)
- **Trend**: Stays near 0 until layer 20, then increases gradually to ~1.2 by layer 30.
- **Key Points**:
- Layer 20: ~0.8
- Layer 30: ~1.2
---
### Key Observations
1. **Peak at Layer 20**: Both **Factual Association** and **Associated Hallucination** reach their highest values (~4.8 and ~4.6, respectively) at layer 20, suggesting a critical layer for these metrics.
2. **Post-Layer 20 Divergence**:
- **Factual Association** declines sharply after layer 20 but recovers by layer 30.
- **Associated Hallucination** drops to near-zero levels after layer 20, indicating a potential reset or correction.
- **Unassociated Hallucination** begins to rise significantly after layer 20, suggesting delayed emergence of unrelated errors.
3. **Normalization**: All values are normalized (0–5), so absolute magnitudes are relative. The y-axis scaling emphasizes proportional changes rather than absolute values.
---
### Interpretation
- **Layer 20 Significance**: The synchronized peak at layer 20 implies this layer plays a pivotal role in both factual associations and associated hallucinations. This could reflect a critical decision-making or representation layer in a neural network.
- **Post-Layer 20 Behavior**:
- The decline in **Factual Association** and **Associated Hallucination** after layer 20 might indicate overcorrection or saturation effects.
- The gradual rise in **Unassociated Hallucination** suggests that later layers introduce noise or errors unrelated to the primary task, possibly due to overfitting or model complexity.
- **Normalization Implications**: The y-axis normalization (0–5) obscures absolute values but highlights relative trends. For example, the ~4.8 peak for **Factual Association** at layer 20 represents the highest relative strength of factual associations across all layers.
---
### Spatial Grounding
- **Legend**: Top-left corner, clearly labeled with color-marker associations.
- **Data Series Placement**:
- Green triangles (**Factual Association**) dominate the upper half of the graph.
- Blue circles (**Associated Hallucination**) peak sharply at layer 20.
- Red squares (**Unassociated Hallucination**) remain near the baseline until layer 20, then rise gradually.
---
### Final Notes
The graph underscores the dynamic interplay between factual accuracy, associated errors, and unassociated errors across layers. The sharp peak at layer 20 and subsequent divergence highlight the importance of layer-specific analysis in understanding model behavior. Further investigation into layer 20’s architecture (e.g., attention mechanisms, activation functions) could clarify its role in these trends.