## Graph Diagram: Network of Nodes
### Overview
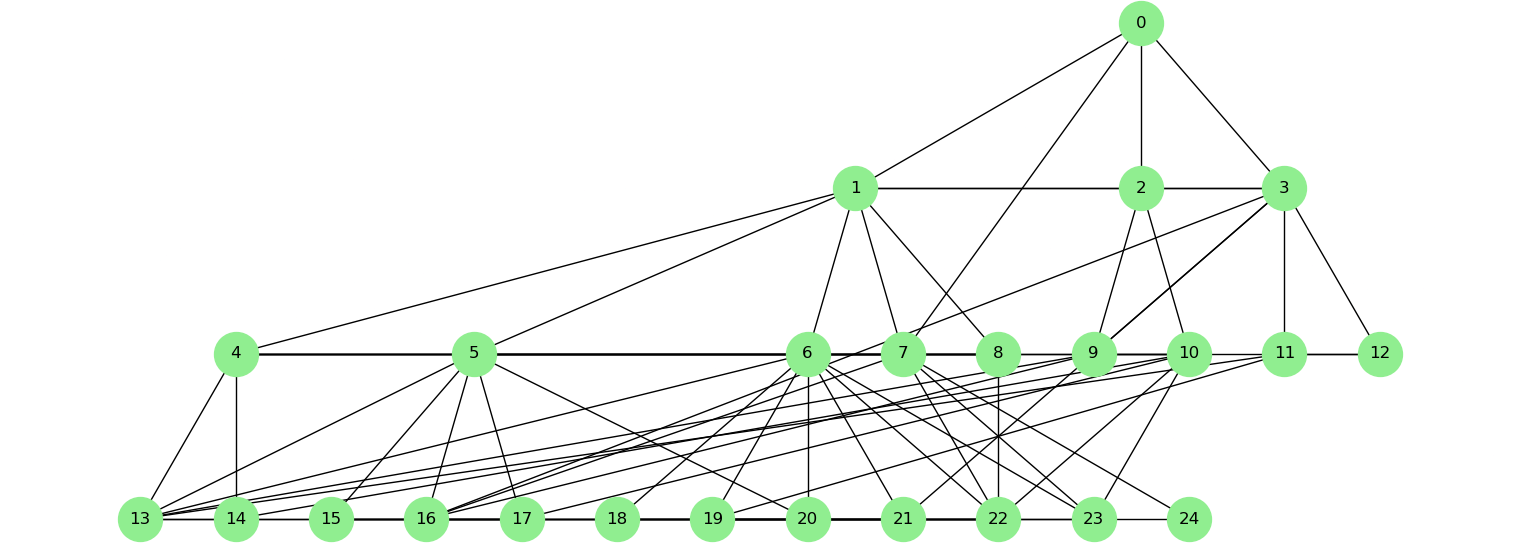
The image depicts a network graph consisting of 25 nodes, numbered 0 through 24. The nodes are represented as light green circles, and the connections between them are indicated by black lines. The graph appears to have a hierarchical structure, with node 0 at the top and nodes 13 through 24 at the bottom.
### Components/Axes
* **Nodes:** 25 nodes, numbered 0 to 24, represented by light green circles.
* **Edges:** Black lines connecting the nodes, indicating relationships or connections.
* **Layout:** The nodes are arranged in a roughly hierarchical manner, with node 0 at the top and nodes 13-24 at the bottom.
### Detailed Analysis
* **Node 0:** Located at the top-center of the graph. It is connected to nodes 1, 2, and 3.
* **Nodes 1, 2, 3:** Located in the second row. Node 1 is connected to nodes 0, 4, 5, 6, 7, 8, 9, and 10. Node 2 is connected to nodes 0, 7, 8, 9, and 10. Node 3 is connected to nodes 0, 10, 11, and 12.
* **Nodes 4, 5, 6, 7, 8, 9, 10, 11, 12:** Located in the third row. Node 4 is connected to nodes 1, 5, 13, and 14. Node 5 is connected to nodes 1, 4, 6, 14, 15, 16, and 17. Node 6 is connected to nodes 1, 5, 7, 17, 18, 19, 20, and 21. Node 7 is connected to nodes 1, 2, 6, 20, 21, and 22. Node 8 is connected to nodes 1, 2, 9, 22, and 23. Node 9 is connected to nodes 1, 2, 8, 10, 23, and 24. Node 10 is connected to nodes 1, 2, 3, 9, 11, and 24. Node 11 is connected to nodes 3, 10, and 24. Node 12 is connected to node 3.
* **Nodes 13, 14, 15, 16, 17, 18, 19, 20, 21, 22, 23, 24:** Located in the bottom row. Node 13 is connected to node 4. Node 14 is connected to nodes 4 and 5. Node 15 is connected to node 5. Node 16 is connected to node 5. Node 17 is connected to nodes 5 and 6. Node 18 is connected to node 6. Node 19 is connected to node 6. Node 20 is connected to nodes 6 and 7. Node 21 is connected to nodes 6 and 7. Node 22 is connected to nodes 7 and 8. Node 23 is connected to nodes 8 and 9. Node 24 is connected to nodes 9, 10, and 11.
### Key Observations
* Node 0 has connections to only 3 other nodes.
* Nodes 1, 2, and 3 act as central hubs, connecting node 0 to the rest of the network.
* Nodes 1, 2, 3, 4, 5, 6, 7, 8, 9, 10, 11, and 12 have multiple connections, while nodes 13-24 have fewer connections.
* The connections between nodes 4-12 and 13-24 are primarily one-way, with nodes 13-24 mostly connecting back to nodes 4-12.
* Nodes 6 and 7 have a high degree of connectivity to the bottom row nodes (17-22).
### Interpretation
The graph represents a network with a hierarchical structure. Node 0 is the root, and the network fans out to the bottom layer (nodes 13-24). The connections suggest a flow or dependency from the top nodes to the bottom nodes. The higher degree of connectivity for nodes 1, 2, and 3 indicates their importance in relaying information or resources from node 0 to the rest of the network. The bottom nodes (13-24) appear to be terminal nodes, with fewer outgoing connections. The graph could represent a variety of systems, such as a social network, a supply chain, or a computer network, where the nodes represent entities and the edges represent relationships or connections between them.