## Network Diagram: Hierarchical Node-Link Graph
### Overview
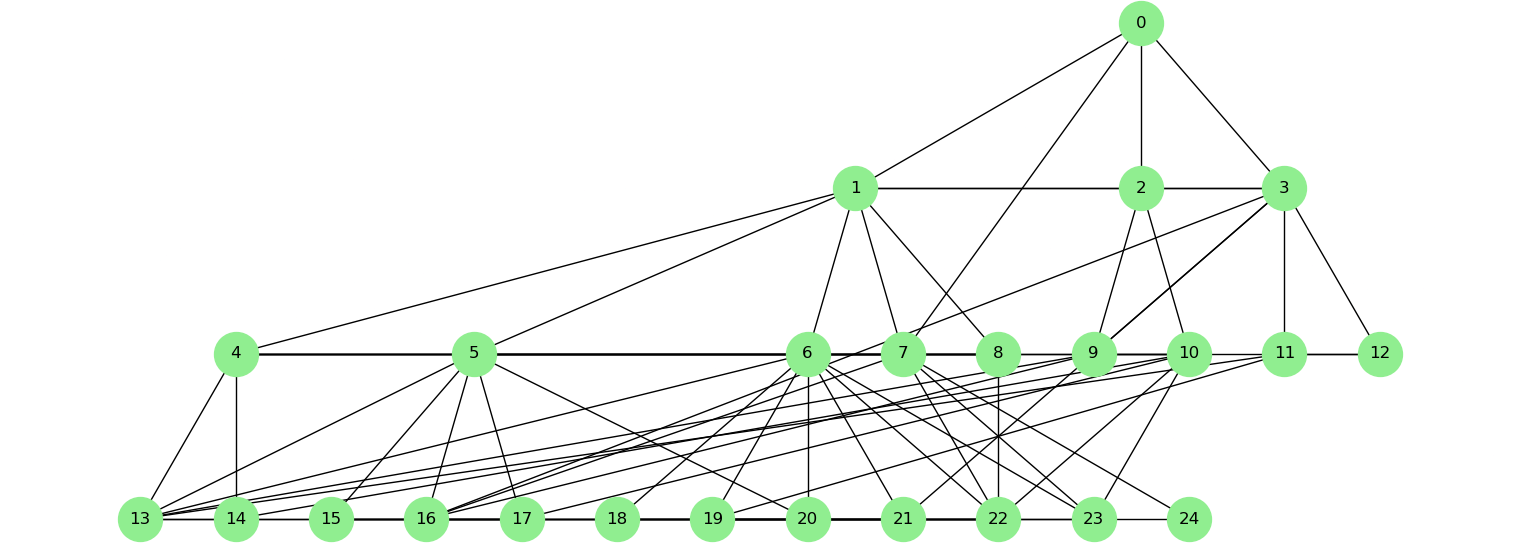
The image displays a complex, multi-layered network graph consisting of 25 nodes, labeled 0 through 24. The nodes are represented as light green circles, and the connections are represented by black lines. The graph is organized into four distinct horizontal layers, suggesting a hierarchical structure, such as a neural network architecture, a dependency graph, or a flow chart.
### Components/Axes
* **Nodes:** 25 circular nodes, numbered 0 to 24.
* **Edges:** Straight black lines representing connections between nodes.
* **Layout Structure:**
* **Layer 1 (Top):** Node 0.
* **Layer 2:** Nodes 1, 2, 3.
* **Layer 3:** Nodes 4, 5, 6, 7, 8, 9, 10, 11, 12.
* **Layer 4 (Bottom):** Nodes 13, 14, 15, 16, 17, 18, 19, 20, 21, 22, 23, 24.
### Detailed Analysis
The graph exhibits a high degree of connectivity, particularly between the middle layers. Below is a breakdown of the connectivity based on visual inspection:
* **Layer 1 (Node 0):** Connects to all nodes in Layer 2 (1, 2, 3).
* **Layer 2 (Nodes 1-3):**
* **Node 1:** Connects to 0, 2, 3 (Layer 2); 4, 5, 6, 7, 8 (Layer 3).
* **Node 2:** Connects to 0, 1, 3 (Layer 2); 7, 9, 10 (Layer 3).
* **Node 3:** Connects to 0, 1, 2 (Layer 2); 6, 9, 10, 11, 12 (Layer 3).
* **Layer 3 (Nodes 4-12):**
* **Node 4:** Connects to 1, 5 (Layer 2/3); 13, 14 (Layer 4).
* **Node 5:** Connects to 1, 4, 6 (Layer 2/3); 13, 14, 15, 16, 17 (Layer 4).
* **Node 6:** Connects to 1, 3, 5, 7 (Layer 2/3); 16, 17, 18, 19, 20, 21 (Layer 4).
* **Node 7:** Connects to 1, 2, 6, 8 (Layer 2/3); 18, 19, 20, 21, 22 (Layer 4).
* **Node 8:** Connects to 1, 7, 9 (Layer 2/3); 20, 21, 22 (Layer 4).
* **Node 9:** Connects to 2, 3, 8, 10 (Layer 2/3); 21, 22, 23 (Layer 4).
* **Node 10:** Connects to 2, 3, 9, 11 (Layer 2/3); 21, 22, 23, 24 (Layer 4).
* **Node 11:** Connects to 3, 10, 12 (Layer 2/3); 23, 24 (Layer 4).
* **Node 12:** Connects to 3, 11 (Layer 2/3); 24 (Layer 4).
* **Layer 4 (Nodes 13-24):**
* These nodes are connected horizontally to their immediate neighbors (e.g., 13-14, 14-15, etc.), forming a chain at the base.
* They also receive multiple vertical connections from Layer 3, acting as the "output" or "terminal" layer of the graph.
### Key Observations
* **Hub Nodes:** Nodes 1, 5, 6, 7, and 10 act as significant hubs, possessing the highest number of connections (degree centrality).
* **Skip Connections:** The graph features "skip connections" where nodes in higher layers connect directly to nodes in lower layers, bypassing intermediate nodes (e.g., Node 1 connects directly to Node 8).
* **Symmetry:** The graph is roughly symmetrical, with the density of connections increasing as one moves from the top (Node 0) toward the middle layers, then tapering off slightly toward the edges (Nodes 4 and 12).
* **Chain Structure:** The bottom layer (13-24) is the only layer with a continuous horizontal chain of connections, suggesting a sequential dependency or a specific output layer structure.
### Interpretation
This diagram is highly characteristic of a **Neural Network architecture**, specifically one utilizing **skip connections** (similar to ResNet or DenseNet architectures).
* **Data Flow:** The structure implies a feed-forward flow from the root (Node 0) down to the terminal layer (13-24).
* **Complexity:** The dense inter-layer connections suggest that information is being aggregated and transformed through multiple paths simultaneously. This is often used in deep learning to mitigate the vanishing gradient problem, allowing information to propagate more effectively through the network.
* **Functional Role:** The bottom layer (13-24) likely represents the output layer, where the horizontal connections might represent a spatial or temporal relationship between the output features (e.g., adjacent pixels in an image or adjacent words in a sentence).