\n
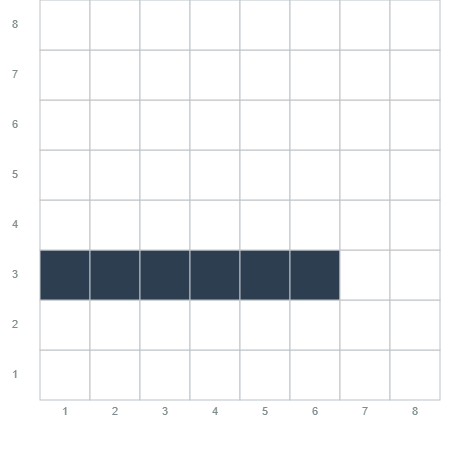
## Chart: Constant Value Plot
### Overview
The image displays a simple chart with a constant value across a range of x-axis values. It appears to be a bar-like representation, where the height of the bars is consistently at the value of 3.
### Components/Axes
* **X-axis:** Ranges from 1 to 8, with integer increments.
* **Y-axis:** Ranges from 1 to 8, with integer increments.
* **Data Series:** A single series represented by dark blue blocks.
* **Grid:** A grid is present, with both horizontal and vertical lines at integer intervals.
### Detailed Analysis
The chart shows a constant value of approximately 3 for all x-values from 1 to 6. There are no data points displayed for x-values 7 and 8.
Specifically:
* At x = 1, the y-value is 3.
* At x = 2, the y-value is 3.
* At x = 3, the y-value is 3.
* At x = 4, the y-value is 3.
* At x = 5, the y-value is 3.
* At x = 6, the y-value is 3.
### Key Observations
The most notable observation is the constant y-value of 3 across the displayed x-axis range. There is no variation in the data. The chart abruptly ends at x=6, with no data points for x=7 and x=8.
### Interpretation
The data suggests a scenario where a particular variable remains constant at a value of 3 over the observed range (x-values 1 to 6). This could represent a stable process, a fixed parameter, or a controlled experiment where the variable is intentionally maintained at a specific level. The absence of data for x=7 and x=8 could indicate the end of the observation period, a limitation of the experiment, or a lack of data collection beyond x=6. The simplicity of the chart suggests a focus on demonstrating this constant value rather than complex relationships or trends.