\n
## Screenshot: Crowdsourcing Task Interface for Evaluating Machine Predictions
### Overview
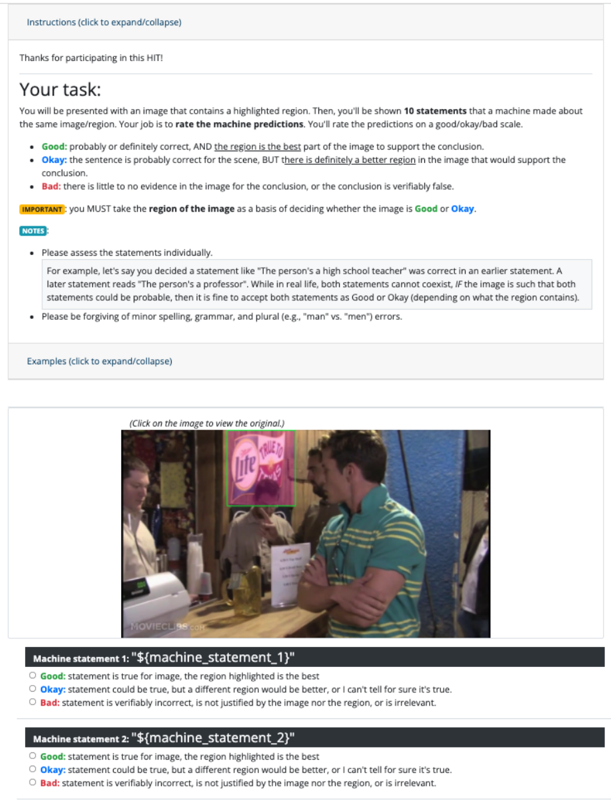
This image is a screenshot of a web-based task interface, likely from a crowdsourcing platform (e.g., Amazon Mechanical Turk, indicated by "HIT"). The interface instructs a human worker to evaluate machine-generated statements about an image. The core task is to rate statements based on whether a highlighted region in the image supports the statement's conclusion. The interface includes instructional text, a sample image with a highlighted region, and a rating form for two placeholder statements.
### Components/Axes
The interface is structured into distinct vertical sections:
1. **Header/Instruction Bar:** A collapsible section labeled "Instructions (click to expand/collapse)".
2. **Task Description Section:**
* **Title:** "Your task:"
* **Core Instruction:** "You will be presented with an image that contains a highlighted region. Then, you'll be shown **10 statements** that a machine made about the same image/region. Your job is to **rate the machine predictions** on a good/okay/bad scale."
* **Rating Scale Definitions:**
* **Good:** "probably or definitely correct, AND **the region is the best** part of the image to support the conclusion."
* **Okay:** "the sentence is probably correct for the scene, BUT **there is definitely a better region** in the image that would support the conclusion."
* **Bad:** "there is little to no evidence in the image for the conclusion, or the conclusion is verifiably false."
* **Important Note (Highlighted in Yellow):** "IMPORTANT: you MUST take **the region of the image** as a basis of deciding whether the image is **Good** or **Okay**."
* **Notes Section:** Contains two bullet points:
* An example explaining how to assess contradictory statements (e.g., "high school teacher" vs. "professor") if the image supports both as probable.
* A reminder: "Please be forgiving of minor spelling, grammar, and plural (e.g., 'man' vs. 'men') errors."
* **Examples Link:** "Examples (click to expand/collapse)".
3. **Image Display Section:**
* A link: "(Click on the image to view the original.)"
* **The Image:** A photograph of an indoor social scene, likely a bar or restaurant.
* **Foreground:** A man in a green and white striped polo shirt is facing right, holding a glass. A bottle of Corona beer is on the counter in front of him.
* **Mid-ground:** Other people are visible, including a woman to the left and another man behind the main subject.
* **Background:** A wall with various decorations.
* **Highlighted Region:** A bright green bounding box is drawn around a neon sign on the wall. The sign reads "Miller Lite" in a stylized font, with "Lite" in a cursive script. The sign is pink/red and white.
4. **Rating Form Section:**
* **Machine statement 1:** `"${machine_statement_1}"` (Placeholder text).
* Radio button options: **Good**, **Okay**, **Bad** (with the same definitions as above).
* **Machine statement 2:** `"${machine_statement_2}"` (Placeholder text).
* Radio button options: **Good**, **Okay**, **Bad**.
### Detailed Analysis
* **Textual Content:** All instructional text, labels, and definitions have been transcribed above. The text is in English.
* **Image Content:** The photograph contains a clear brand sign ("Miller Lite") which is the focus of the highlighted region. The scene suggests a casual, social drinking environment.
* **Interface Logic:** The rating system is conditional. The distinction between "Good" and "Okay" hinges entirely on whether the *highlighted region* is the *best* evidence for the statement, not just whether the statement is true. A statement can be true ("Okay") if a better region exists elsewhere in the image.
* **Placeholder Data:** The machine statements (`${machine_statement_1}`, `${machine_statement_2}`) are variables, indicating this is a template view before the actual task data is loaded.
### Key Observations
1. **Task Design:** The interface is designed to collect nuanced human judgments about the *grounding* of machine statements, not just their factual accuracy. This is a common setup for training or evaluating visual question answering (VQA) or image captioning models.
2. **Critical Instruction:** The yellow-highlighted "IMPORTANT" note is the most crucial rule: the highlighted region is the primary basis for the "Good" vs. "Okay" decision.
3. **Example Purpose:** The provided example about the "teacher/professor" statements serves to clarify that the task is about *image-based probability*, not real-world mutually exclusive facts.
4. **Visual Cue:** The green bounding box is a strong visual cue directing the worker's attention to a specific part of the image (the Miller Lite sign), which would be the subject of the (currently hidden) machine statements.
### Interpretation
This screenshot documents a **human-in-the-loop evaluation protocol for AI systems**. The data collected from this task would be used to assess how well a machine's textual statements are supported by specific visual evidence (the highlighted region). The three-tier rating scale (Good/Okay/Bad) captures a gradient of alignment between the statement, the highlighted evidence, and the full image context.
The presence of the Miller Lite sign in the highlighted region suggests that the hidden machine statements likely pertain to that sign (e.g., "There is a beer advertisement," "The sign says 'Miller Lite'"). A "Good" rating would require the statement to be correct *and* the sign to be the best supporting region. An "Okay" rating might apply if the statement is correct (e.g., "This is a bar") but a wider view of the room would be better evidence. A "Bad" rating would be for a statement like "The person is drinking a Miller Lite" (the person has a Corona bottle) or if the statement is false.
The interface is a tool for generating high-quality, grounded evaluation data, which is essential for improving the reliability and explainability of multimodal AI models. The careful wording of the instructions aims to standardize human judgments and reduce ambiguity in the collected labels.