## Chart: Number of Clauses Stored vs. Number of Clauses in the Formula
### Overview
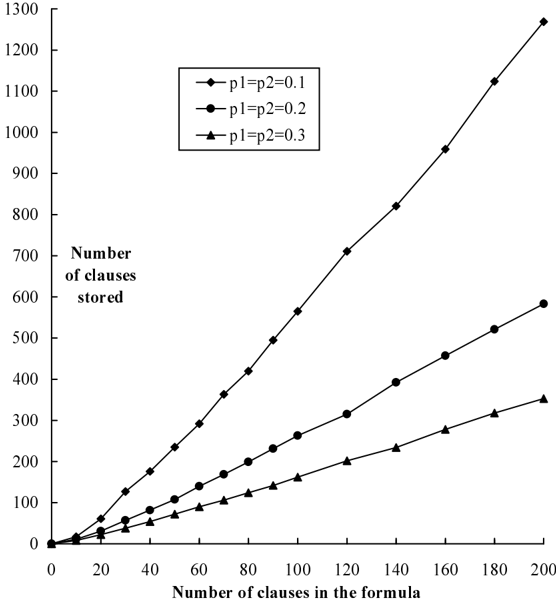
The image is a line chart comparing the number of clauses stored versus the number of clauses in the formula for three different parameter settings: p1=p2=0.1, p1=p2=0.2, and p1=p2=0.3. The x-axis represents the number of clauses in the formula, and the y-axis represents the number of clauses stored. All three lines show an increasing trend, with p1=p2=0.1 having the steepest slope and thus the highest number of clauses stored for a given number of clauses in the formula.
### Components/Axes
* **X-axis:** Number of clauses in the formula. Scale ranges from 0 to 200, with tick marks at intervals of 20.
* **Y-axis:** Number of clauses stored. Scale ranges from 0 to 1300, with tick marks at intervals of 100.
* **Legend (top-right):**
* Line with diamond markers: p1=p2=0.1
* Line with circle markers: p1=p2=0.2
* Line with triangle markers: p1=p2=0.3
### Detailed Analysis
* **p1=p2=0.1 (diamond markers):** The line starts at approximately (0,0) and increases almost linearly.
* At x=20, y ≈ 80
* At x=40, y ≈ 170
* At x=60, y ≈ 270
* At x=80, y ≈ 370
* At x=100, y ≈ 470
* At x=120, y ≈ 580
* At x=140, y ≈ 700
* At x=160, y ≈ 830
* At x=180, y ≈ 980
* At x=200, y ≈ 1200
* **p1=p2=0.2 (circle markers):** The line starts at approximately (0,0) and increases, but at a slower rate than p1=p2=0.1.
* At x=20, y ≈ 30
* At x=40, y ≈ 70
* At x=60, y ≈ 120
* At x=80, y ≈ 180
* At x=100, y ≈ 240
* At x=120, y ≈ 300
* At x=140, y ≈ 370
* At x=160, y ≈ 440
* At x=180, y ≈ 510
* At x=200, y ≈ 580
* **p1=p2=0.3 (triangle markers):** The line starts at approximately (0,0) and increases at the slowest rate among the three.
* At x=20, y ≈ 10
* At x=40, y ≈ 30
* At x=60, y ≈ 60
* At x=80, y ≈ 90
* At x=100, y ≈ 120
* At x=120, y ≈ 160
* At x=140, y ≈ 200
* At x=160, y ≈ 240
* At x=180, y ≈ 290
* At x=200, y ≈ 350
### Key Observations
* All three lines start at or near the origin (0,0).
* The line representing p1=p2=0.1 has the steepest slope, indicating a higher number of clauses stored for a given number of clauses in the formula compared to the other two parameter settings.
* The line representing p1=p2=0.3 has the shallowest slope, indicating the lowest number of clauses stored for a given number of clauses in the formula.
* The relationship between the number of clauses in the formula and the number of clauses stored appears to be approximately linear for all three parameter settings, although there might be a slight curve, especially for p1=p2=0.1.
### Interpretation
The chart demonstrates the relationship between the number of clauses in a formula and the number of clauses stored, under different parameter settings (p1 and p2). The parameter setting p1=p2=0.1 results in the highest number of clauses stored for a given number of clauses in the formula, suggesting that this setting is more efficient in storing clauses. Conversely, p1=p2=0.3 results in the lowest number of clauses stored, indicating lower efficiency. The approximately linear relationship suggests a direct proportionality between the number of clauses in the formula and the number of clauses stored, with the slope of the line determined by the parameter settings. The data suggests that the values of p1 and p2 significantly impact the storage efficiency of clauses in the formula.