## Line Chart: Number of Clauses Stored vs. Number of Clauses in the Formula
### Overview
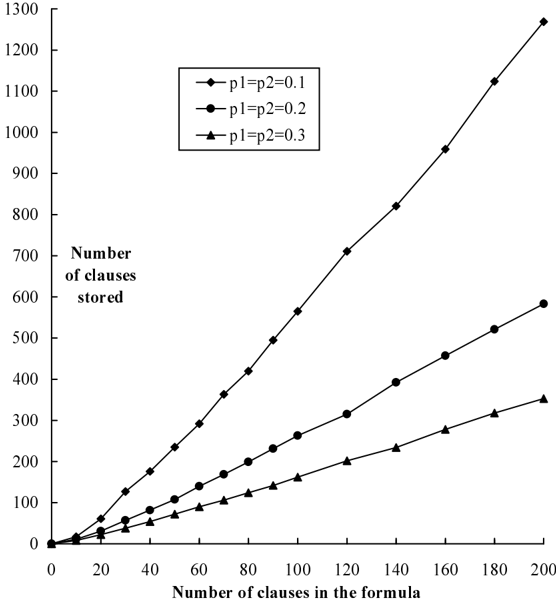
This image presents a line chart illustrating the relationship between the number of clauses in a formula and the number of clauses stored, for three different probability values (p1=p2). The chart displays how the number of stored clauses increases with the number of clauses in the formula, varying based on the specified probability.
### Components/Axes
* **X-axis:** "Number of clauses in the formula", ranging from 0 to 200, with increments of 20.
* **Y-axis:** "Number of clauses stored", ranging from 0 to 1300, with increments of 100.
* **Legend:** Located in the top-right corner, containing three lines with associated labels:
* "p1=p2=0.1" (represented by a diamond-shaped marker and a light gray line)
* "p1=p2=0.2" (represented by a circle-shaped marker and a black line)
* "p1=p2=0.3" (represented by a triangle-shaped marker and a dark gray line)
### Detailed Analysis
The chart shows three distinct lines, each representing a different probability value.
* **Line 1 (p1=p2=0.1):** This line slopes upward, indicating a positive correlation between the number of clauses in the formula and the number of clauses stored.
* At 0 clauses in the formula, approximately 0 clauses are stored.
* At 20 clauses in the formula, approximately 20 clauses are stored.
* At 40 clauses in the formula, approximately 40 clauses are stored.
* At 60 clauses in the formula, approximately 60 clauses are stored.
* At 80 clauses in the formula, approximately 80 clauses are stored.
* At 100 clauses in the formula, approximately 100 clauses are stored.
* At 120 clauses in the formula, approximately 120 clauses are stored.
* At 140 clauses in the formula, approximately 140 clauses are stored.
* At 160 clauses in the formula, approximately 160 clauses are stored.
* At 180 clauses in the formula, approximately 180 clauses are stored.
* At 200 clauses in the formula, approximately 200 clauses are stored.
* **Line 2 (p1=p2=0.2):** This line also slopes upward, but at a steeper rate than Line 1.
* At 0 clauses in the formula, approximately 0 clauses are stored.
* At 20 clauses in the formula, approximately 40 clauses are stored.
* At 40 clauses in the formula, approximately 80 clauses are stored.
* At 60 clauses in the formula, approximately 120 clauses are stored.
* At 80 clauses in the formula, approximately 160 clauses are stored.
* At 100 clauses in the formula, approximately 200 clauses are stored.
* At 120 clauses in the formula, approximately 240 clauses are stored.
* At 140 clauses in the formula, approximately 280 clauses are stored.
* At 160 clauses in the formula, approximately 320 clauses are stored.
* At 180 clauses in the formula, approximately 360 clauses are stored.
* At 200 clauses in the formula, approximately 400 clauses are stored.
* **Line 3 (p1=p2=0.3):** This line has the steepest upward slope, indicating the strongest positive correlation.
* At 0 clauses in the formula, approximately 0 clauses are stored.
* At 20 clauses in the formula, approximately 60 clauses are stored.
* At 40 clauses in the formula, approximately 120 clauses are stored.
* At 60 clauses in the formula, approximately 180 clauses are stored.
* At 80 clauses in the formula, approximately 240 clauses are stored.
* At 100 clauses in the formula, approximately 300 clauses are stored.
* At 120 clauses in the formula, approximately 360 clauses are stored.
* At 140 clauses in the formula, approximately 420 clauses are stored.
* At 160 clauses in the formula, approximately 480 clauses are stored.
* At 180 clauses in the formula, approximately 540 clauses are stored.
* At 200 clauses in the formula, approximately 600 clauses are stored.
### Key Observations
* The number of clauses stored increases linearly with the number of clauses in the formula for all three probability values.
* Higher probability values (p1=p2=0.3) result in a significantly greater number of clauses stored compared to lower probability values (p1=p2=0.1).
* The relationship appears to be approximately proportional, but the lines are not perfectly straight, suggesting some non-linear behavior or noise in the data.
### Interpretation
The chart demonstrates that the number of clauses stored is directly proportional to the number of clauses in the formula, and this relationship is heavily influenced by the probability values p1 and p2. A higher probability leads to a greater number of clauses being stored for the same number of clauses in the formula. This suggests that the probability values represent a threshold or a weighting factor determining how many clauses are considered significant enough to be stored. The linear trend indicates a consistent storage mechanism, while the differences between the lines highlight the impact of the probability parameter on the storage process. The data suggests that the storage mechanism becomes more aggressive (stores more clauses) as the probability increases. This could be related to a confidence level or a decision-making process where higher probabilities lead to more clauses being retained.