## Line Chart: Relationship Between Clauses in Formula and Clauses Stored
### Overview
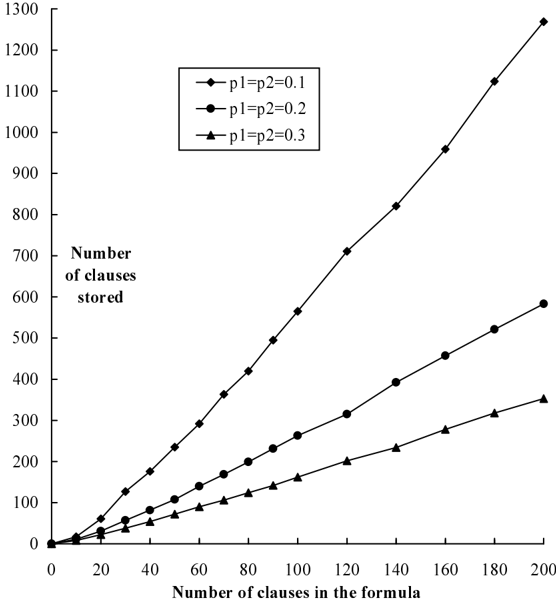
The chart illustrates the relationship between the number of clauses in a formula and the number of clauses stored, across three distinct scenarios defined by the parameters `p1=p2=0.1`, `p1=p2=0.2`, and `p1=p2=0.3`. Each scenario is represented by a distinct line with unique markers and colors. The y-axis represents the "Number of clauses stored," while the x-axis represents the "Number of clauses in the formula."
### Components/Axes
- **X-Axis (Horizontal)**: Labeled "Number of clauses in the formula," ranging from 0 to 200 in increments of 20.
- **Y-Axis (Vertical)**: Labeled "Number of clauses stored," ranging from 0 to 1300 in increments of 100.
- **Legend**: Positioned in the top-right corner, with three entries:
- **Black circles**: `p1=p2=0.1`
- **Dark gray squares**: `p1=p2=0.2`
- **Light gray triangles**: `p1=p2=0.3`
### Detailed Analysis
1. **`p1=p2=0.1` (Black Circles)**:
- Starts at (0, 0) and increases steadily.
- Approximate values:
- At x=20: ~50
- At x=100: ~300
- At x=200: ~580
2. **`p1=p2=0.2` (Dark Gray Squares)**:
- Starts at (0, 0) with a steeper slope than `p1=p2=0.1`.
- Approximate values:
- At x=20: ~70
- At x=100: ~450
- At x=200: ~540
3. **`p1=p2=0.3` (Light Gray Triangles)**:
- Starts at (0, 0) with the steepest slope.
- Approximate values:
- At x=20: ~90
- At x=100: ~600
- At x=200: ~1280 (near the y-axis maximum of 1300)
### Key Observations
- The `p1=p2=0.3` series (light gray triangles) exhibits the fastest growth, surpassing all other series by x=200.
- The `p1=p2=0.2` series (dark gray squares) initially grows faster than `p1=p2=0.1` but falls below it at x=200, suggesting an anomaly or non-linear behavior.
- All series begin at (0, 0), indicating no stored clauses when no clauses are in the formula.
### Interpretation
The data suggests a direct proportionality between the number of clauses in the formula and the number stored, with higher `p1=p2` values generally leading to greater storage efficiency. However, the `p1=p2=0.2` series deviates from this trend at higher x-values, potentially indicating:
1. A data collection error or mislabeling in the legend.
2. A non-linear relationship not captured by the linear model.
3. A threshold effect where `p1=p2=0.3` becomes disproportionately effective.
The legend’s placement and color coding enhance clarity, but the inconsistency in the `p1=p2=0.2` series warrants further investigation to validate the underlying assumptions or data accuracy.