## Scatter Plot: Layer 10, head 0
### Overview
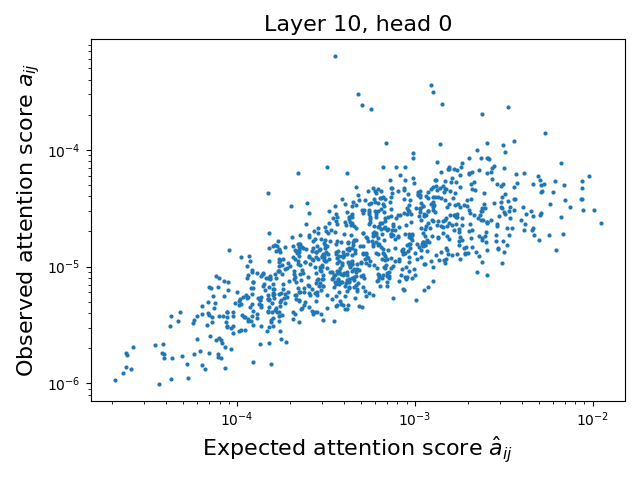
The image is a scatter plot comparing **observed attention scores** (y-axis) to **expected attention scores** (x-axis) for a neural network layer (Layer 10, head 0). Both axes use logarithmic scales, with the x-axis ranging from 10⁻⁴ to 10⁻² and the y-axis from 10⁻⁶ to 10⁻⁴. Data points are represented as blue dots, showing a dispersed distribution with no explicit trendline or regression line.
---
### Components/Axes
- **X-axis (Expected attention score â_ij)**: Logarithmic scale (10⁻⁴ to 10⁻²).
- **Y-axis (Observed attention score a_ij)**: Logarithmic scale (10⁻⁶ to 10⁻⁴).
- **Data Points**: Blue dots scattered across the plot.
- **Title**: "Layer 10, head 0" (top center).
- **Legend**: Absent.
---
### Detailed Analysis
- **Data Distribution**:
- Most points cluster in the mid-range of both axes (x: ~10⁻³ to 10⁻³·⁵, y: ~10⁻⁵ to 10⁻⁴·⁵).
- A few outliers extend to the upper bounds of the axes (e.g., x ≈ 10⁻², y ≈ 10⁻⁴).
- No clear linear or exponential trend; points are broadly dispersed.
- **Scale Implications**:
- Logarithmic axes emphasize multiplicative differences. For example, a 10⁻³ value on the x-axis is 10× larger than 10⁻⁴.
- Observed scores (y-axis) generally align with or slightly exceed expected scores (x-axis) in the mid-range.
---
### Key Observations
1. **Positive Correlation**: Observed scores tend to increase with expected scores, though the relationship is weak and noisy.
2. **Outliers**:
- A small cluster of points near (x ≈ 10⁻², y ≈ 10⁻⁴) suggests overestimation in high-expected-score cases.
- Points near (x ≈ 10⁻⁴, y ≈ 10⁻⁶) indicate underestimation in low-expected-score cases.
3. **Scale Sensitivity**: The logarithmic axes compress high-value differences, making small variations appear less pronounced.
---
### Interpretation
- **Model Behavior**: The plot suggests that the attention mechanism in Layer 10, head 0, generally aligns with expected scores but exhibits variability. This could reflect:
- **Model Uncertainty**: Noise in the attention computation or training data.
- **Task Complexity**: Difficulty in predicting attention for certain input patterns.
- **Outlier Significance**: High-expected-score outliers may correspond to rare or ambiguous inputs where the model’s attention mechanism diverges significantly from expectations.
- **Practical Implications**: The lack of a strong trend implies the model’s attention scores are not perfectly calibrated, which could affect downstream tasks like interpretability or robustness.
---
**Note**: No textual legends or embedded diagrams are present. All data points are blue, and no additional categories or sub-categories are labeled.