## Line Graph: Hopper v.s. Non-Hopper on Ling-flash-2.0
### Overview
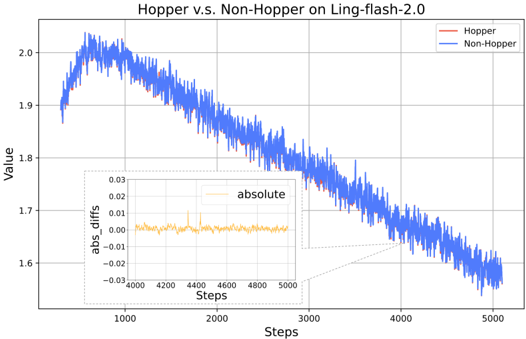
The image is a line graph comparing the performance of two systems, "Hopper" (red line) and "Non-Hopper" (blue line), over 5,000 steps on the Ling-flash-2.0 benchmark. A secondary inset graph shows the absolute differences between the two systems. Both lines exhibit a general downward trend, with the Hopper line starting higher but declining more steeply than the Non-Hopper line.
---
### Components/Axes
- **Main Chart**:
- **X-axis**: "Steps" (ranging from 1,000 to 5,000 in increments of 1,000).
- **Y-axis**: "Value" (ranging from 1.6 to 2.0 in increments of 0.1).
- **Legend**: Located in the top-right corner, with red representing "Hopper" and blue representing "Non-Hopper".
- **Inset Graph**:
- **X-axis**: "Steps" (same range as the main chart, 4,000–5,000).
- **Y-axis**: "abs_diffs" (absolute differences, ranging from -0.03 to 0.03).
- **Line**: Orange, labeled "absolute".
---
### Detailed Analysis
1. **Hopper (Red Line)**:
- Starts at approximately **2.0** at step 1,000.
- Peaks near **2.0** at step 2,000.
- Declines steadily to **~1.6** by step 5,000.
- Shows higher variability (noise) in the early steps (1,000–3,000) compared to later steps.
2. **Non-Hopper (Blue Line)**:
- Starts at approximately **1.9** at step 1,000.
- Declines gradually to **~1.6** by step 5,000.
- Maintains a consistent downward slope with less variability than the Hopper line.
3. **Absolute Differences (Inset)**:
- The orange line fluctuates between **-0.03** and **0.03**.
- Peaks at **~0.03** around step 4,500, indicating the largest divergence between the two systems.
- Most values cluster around **0.01–0.02**, suggesting the systems converge over time.
---
### Key Observations
- The Hopper system begins with a higher value than Non-Hopper but declines more sharply.
- The absolute difference between the two systems is smallest in the early steps (~0.01–0.02) and grows slightly in the later steps (~0.03).
- Both systems converge to similar values (~1.6) by step 5,000, though Hopper’s trajectory is more volatile.
---
### Interpretation
The data suggests that the Hopper system initially outperforms the Non-Hopper system but experiences a steeper decline in performance over time. The absolute differences indicate that while Hopper starts with an advantage, this gap narrows as steps increase, with both systems eventually stabilizing at similar values. The spikes in the absolute difference inset (e.g., ~0.03 at step 4,500) may reflect transient anomalies or specific interactions between the systems. The convergence at step 5,000 implies that long-term performance differences are minimal, though Hopper’s higher initial variability could indicate instability or sensitivity to early conditions.