## Diagram: NeuroBench Benchmark Process
### Overview
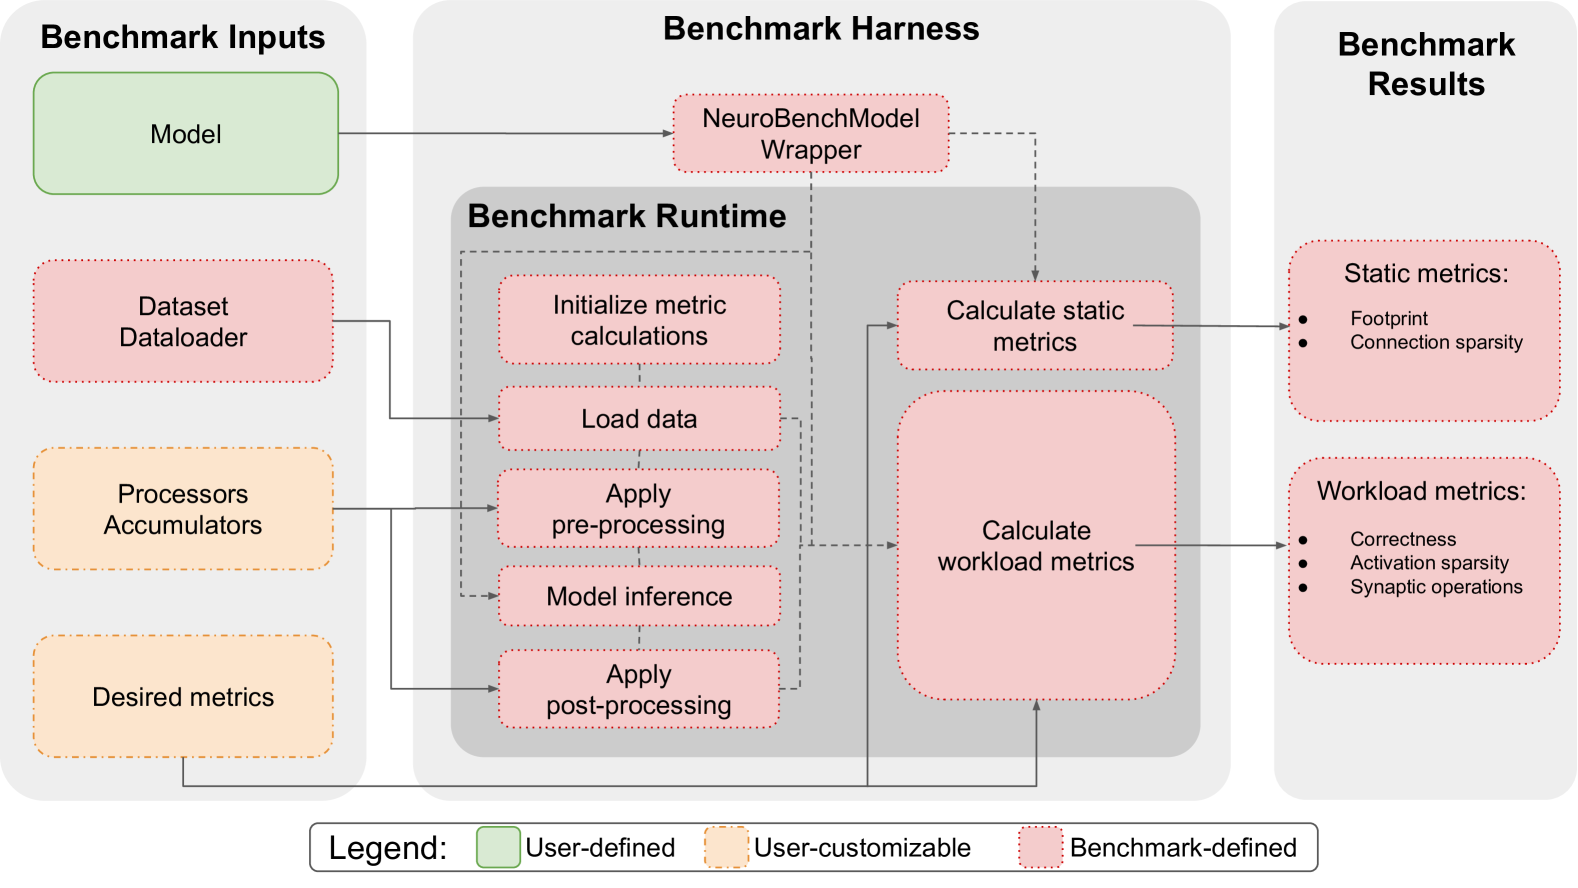
The image is a diagram illustrating the NeuroBench benchmark process, outlining the inputs, harness, and results. It shows the flow of data and operations within the benchmarking framework, categorizing elements as user-defined, user-customizable, or benchmark-defined.
### Components/Axes
* **Title:** NeuroBench Benchmark Process (inferred)
* **Sections:**
* Benchmark Inputs (left)
* Benchmark Harness (center)
* Benchmark Results (right)
* **Legend:** Located at the bottom of the diagram.
* Green: User-defined
* Orange: User-customizable
* Pink: Benchmark-defined
### Detailed Analysis
**1. Benchmark Inputs (Left)**
* **Model** (Green box): User-defined.
* **Dataset Dataloader** (Pink box with dotted outline): Benchmark-defined.
* **Processors Accumulators** (Orange box with dotted outline): User-customizable.
* **Desired metrics** (Orange box with dotted outline): User-customizable.
**2. Benchmark Harness (Center)**
* **NeuroBenchModel Wrapper** (Pink box with dotted outline): Benchmark-defined. Located at the top of the "Benchmark Harness" section.
* **Benchmark Runtime** (Gray area): Encloses the following processes:
* **Initialize metric calculations** (Pink box with dotted outline): Benchmark-defined.
* **Load data** (Pink box with dotted outline): Benchmark-defined.
* **Apply pre-processing** (Pink box with dotted outline): Benchmark-defined.
* **Model inference** (Pink box with dotted outline): Benchmark-defined.
* **Apply post-processing** (Pink box with dotted outline): Benchmark-defined.
* **Calculate static metrics** (Pink box with dotted outline): Benchmark-defined.
* **Calculate workload metrics** (Pink box with dotted outline): Benchmark-defined.
**3. Benchmark Results (Right)**
* **Static metrics** (Pink box with dotted outline): Benchmark-defined.
* Footprint
* Connection sparsity
* **Workload metrics** (Pink box with dotted outline): Benchmark-defined.
* Correctness
* Activation sparsity
* Synaptic operations
**Flow of Information:**
* The "Model" from "Benchmark Inputs" flows into the "NeuroBenchModel Wrapper" in "Benchmark Harness".
* "Dataset Dataloader" and "Processors Accumulators" from "Benchmark Inputs" flow into "Benchmark Runtime".
* Within "Benchmark Runtime", the processes occur sequentially: "Initialize metric calculations", "Load data", "Apply pre-processing", "Model inference", and "Apply post-processing".
* "Calculate static metrics" receives input from "Initialize metric calculations".
* "Calculate workload metrics" receives input from "Apply post-processing".
* The outputs of "Calculate static metrics" and "Calculate workload metrics" flow into "Benchmark Results" as "Static metrics" and "Workload metrics" respectively.
### Key Observations
* The diagram clearly separates the responsibilities of the user and the benchmark framework.
* The "Benchmark Harness" section is primarily benchmark-defined, indicating a standardized process.
* The flow of data and operations is well-defined, showing the sequence of steps in the benchmarking process.
### Interpretation
The diagram provides a high-level overview of the NeuroBench benchmarking process. It highlights the modularity of the framework, allowing users to provide their own models and customize certain aspects while relying on the benchmark for standardized data loading, processing, and metric calculation. The separation of static and workload metrics suggests a comprehensive evaluation approach, considering both the model's structure and its performance under different workloads. The diagram serves as a useful guide for understanding the overall architecture and workflow of the NeuroBench framework.