\n
## Diagram: NeuroBench Benchmark Flow
### Overview
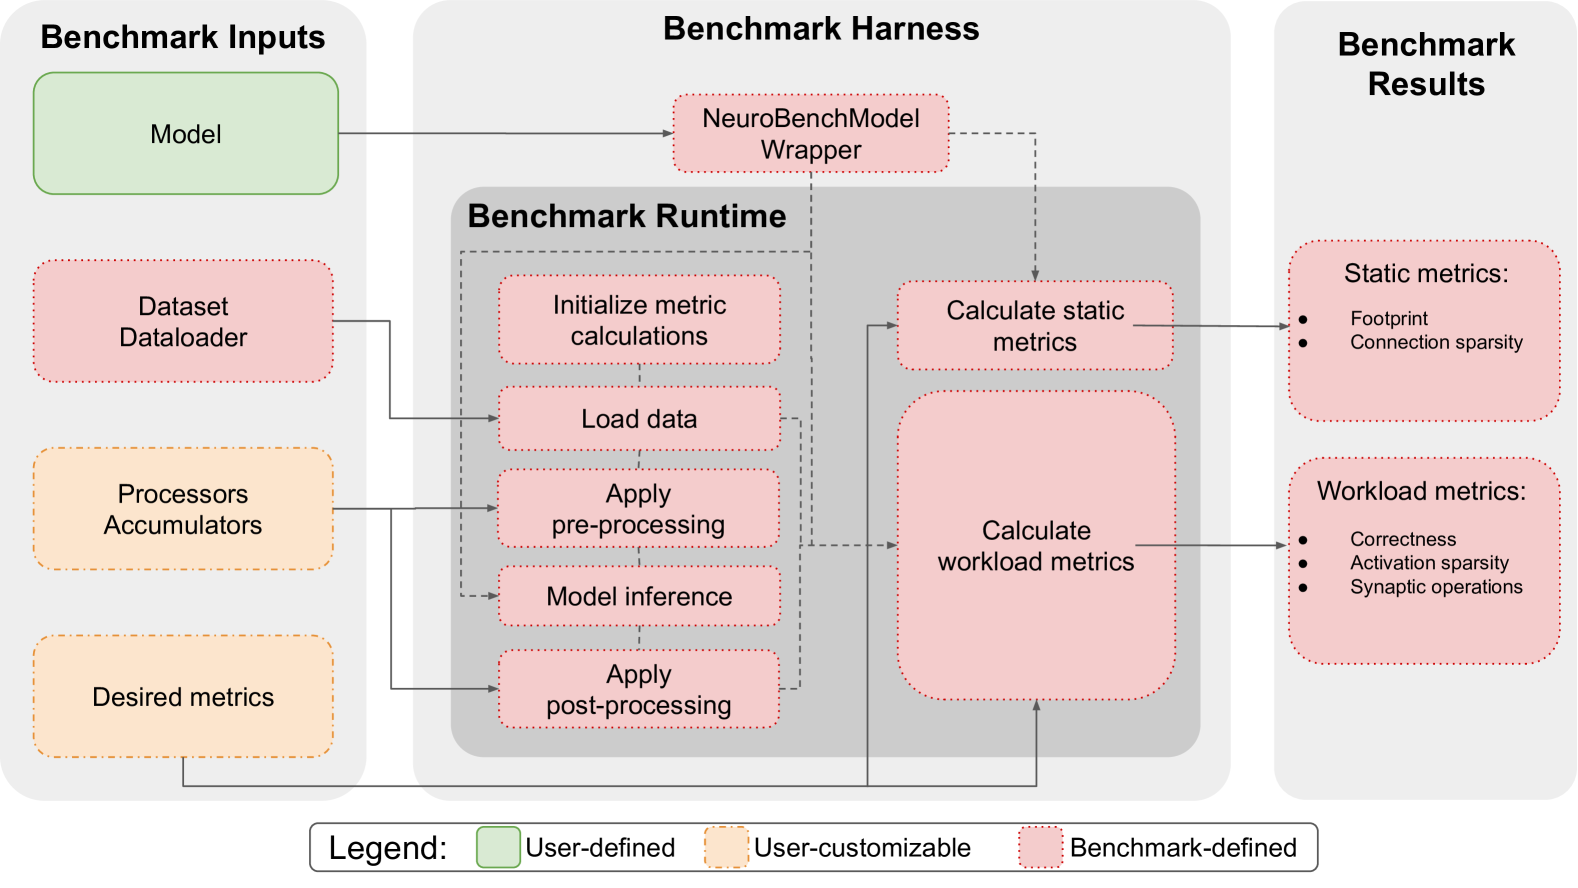
This diagram illustrates the flow of a NeuroBench benchmark, outlining the inputs, processing stages within the harness, and the resulting outputs. The diagram is segmented into three main areas: "Benchmark Inputs" (left), "Benchmark Harness" (center), and "Benchmark Results" (right). The central "Benchmark Runtime" section is the core processing unit, connecting inputs to outputs.
### Components/Axes
The diagram consists of rounded rectangles representing components, with arrows indicating the flow of data or control. The legend at the bottom defines the color-coding for component types:
* **Orange:** User-defined
* **Yellow:** User-customizable
* **Green:** Benchmark-defined
The main components are:
* **Benchmark Inputs:** Model, Dataset Dataloader, Processors Accumulators, Desired metrics
* **Benchmark Harness:** NeuroBenchModel Wrapper, Benchmark Runtime (containing Initialize metric calculations, Load data, Apply pre-processing, Model inference, Apply post-processing), Calculate static metrics, Calculate workload metrics
* **Benchmark Results:** Static metrics (Footprint, Connection sparsity), Workload metrics (Correctness, Activation sparsity, Synaptic operations)
### Detailed Analysis or Content Details
The diagram shows a clear data flow:
1. **Inputs:**
* "Model" (orange) feeds into "NeuroBenchModel Wrapper" (green).
* "Dataset Dataloader" (orange) feeds into "Load data" (yellow) within the Benchmark Runtime.
* "Processors Accumulators" (orange) feed into "Model inference" (yellow) within the Benchmark Runtime.
* "Desired metrics" (orange) feed into "Initialize metric calculations" (yellow) within the Benchmark Runtime.
2. **Benchmark Runtime:**
* "Initialize metric calculations" (yellow) connects to "Calculate static metrics" (green) and "Calculate workload metrics" (green).
* "Load data" (yellow) connects to "Apply pre-processing" (yellow).
* "Apply pre-processing" (yellow) connects to "Model inference" (yellow).
* "Model inference" (yellow) connects to "Apply post-processing" (yellow).
* "Apply post-processing" (yellow) connects to "Calculate static metrics" (green) and "Calculate workload metrics" (green).
3. **Outputs:**
* "Calculate static metrics" (green) outputs "Static metrics" (Footprint, Connection sparsity) (green).
* "Calculate workload metrics" (green) outputs "Workload metrics" (Correctness, Activation sparsity, Synaptic operations) (green).
The dashed lines indicate a potential flow or dependency between components, but the exact nature isn't specified.
### Key Observations
The diagram emphasizes the modularity of the NeuroBench framework. The "Benchmark Runtime" acts as a central processing unit, integrating user-defined inputs with benchmark-defined components. The clear separation of inputs, processing, and outputs suggests a well-defined and structured benchmarking process. The color-coding effectively highlights the level of user control over different aspects of the benchmark.
### Interpretation
This diagram represents a system for evaluating neural network performance. The NeuroBench framework allows users to define the model, dataset, processors, and desired metrics (orange components), while the core benchmarking logic and calculations are handled by the framework itself (green and yellow components). The outputs provide insights into both the resource usage (static metrics) and the functional behavior (workload metrics) of the model.
The dashed lines suggest that the "NeuroBenchModel Wrapper" and the runtime components have a more complex relationship than a simple linear flow. This could indicate that the wrapper handles model-specific adaptations or optimizations within the benchmark environment.
The diagram is a high-level overview and doesn't delve into the specific algorithms or implementations used within each component. However, it effectively communicates the overall architecture and data flow of the NeuroBench benchmarking process. It is a conceptual illustration, not a detailed technical specification.