TECHNICAL ASSET FINGERPRINT
80d9d0f9bbe6c8401306dd6a
Click to view fullscreen
Press ESC or click to close
FOUND IN PAPERS
EXPERT: healer-alpha-free VERSION 1
RUNTIME: free/openrouter/healer-alpha
INTEL_VERIFIED
## Diagram: NeuroBench Benchmarking Framework Flowchart
### Overview
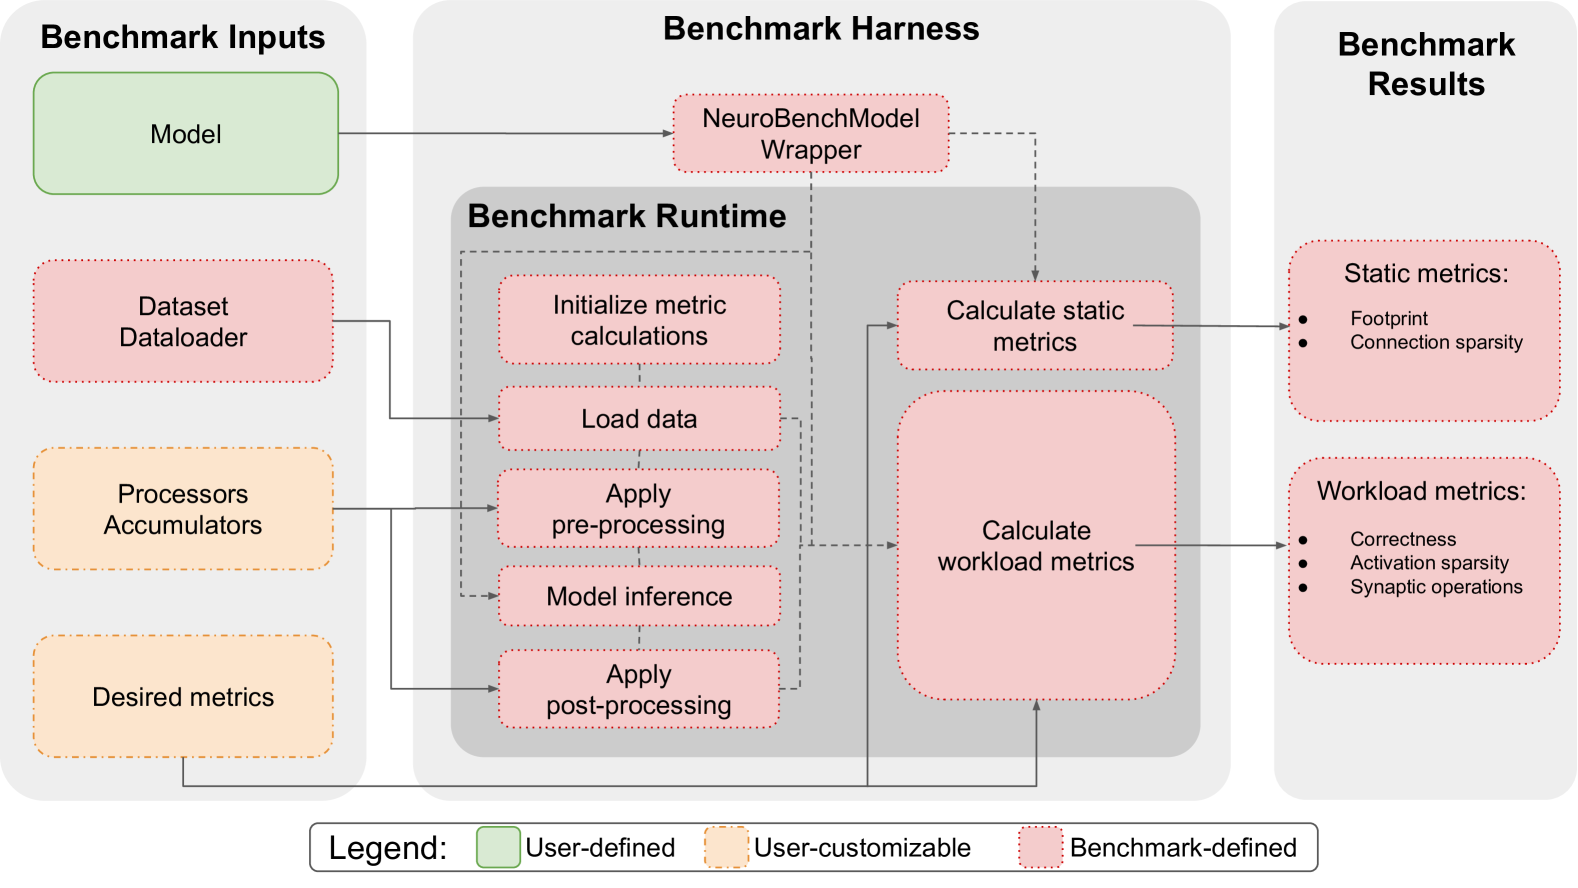
This image is a technical flowchart illustrating the architecture and workflow of a benchmarking framework, likely for neural network or neuromorphic computing models. The diagram is divided into three primary vertical sections: **Benchmark Inputs** (left), **Benchmark Harness** (center), and **Benchmark Results** (right). A legend at the bottom defines the color-coding for component types. The flow of data and control is indicated by solid and dashed arrows.
### Components/Axes
The diagram is structured into three main panels and a legend.
**1. Benchmark Inputs (Left Panel)**
* **Model** (Green box, top-left): User-defined component.
* **Dataset Dataloader** (Pink box, middle-left): Benchmark-defined component.
* **Processors Accumulators** (Orange box, lower-middle-left): User-customizable component.
* **Desired metrics** (Orange box, bottom-left): User-customizable component.
**2. Benchmark Harness (Center Panel)**
This panel contains two nested sections:
* **NeuroBenchModel Wrapper** (Pink box, top-center): Benchmark-defined component. Receives input from the "Model".
* **Benchmark Runtime** (Gray shaded box, center):
* **Initialize metric calculations** (Pink box, top of runtime): Benchmark-defined.
* **Load data** (Pink box, below Initialize): Benchmark-defined. Receives input from "Dataset Dataloader".
* **Apply pre-processing** (Pink box, below Load data): Benchmark-defined. Receives input from "Processors Accumulators".
* **Model inference** (Pink box, below pre-processing): Benchmark-defined.
* **Apply post-processing** (Pink box, bottom of runtime): Benchmark-defined.
* **Calculate static metrics** (Pink box, right of runtime): Benchmark-defined. Receives input from "NeuroBenchModel Wrapper".
* **Calculate workload metrics** (Large pink box, right of runtime): Benchmark-defined. Receives input from the runtime sequence (dashed arrow from "Apply post-processing") and from "Desired metrics".
**3. Benchmark Results (Right Panel)**
* **Static metrics:** (Pink box, top-right): Benchmark-defined. Receives output from "Calculate static metrics".
* Contains a bulleted list:
* Footprint
* Connection sparsity
* **Workload metrics:** (Pink box, bottom-right): Benchmark-defined. Receives output from "Calculate workload metrics".
* Contains a bulleted list:
* Correctness
* Activation sparsity
* Synaptic operations
**4. Legend (Bottom Center)**
* **User-defined:** Green solid fill.
* **User-customizable:** Orange fill with a dashed border.
* **Benchmark-defined:** Pink fill with a dotted border.
### Detailed Analysis
**Flow and Connections:**
1. The **Model** (user-defined) is fed into the **NeuroBenchModel Wrapper** (benchmark-defined).
2. The **Dataset Dataloader** (benchmark-defined) provides data to the **Load data** step within the Benchmark Runtime.
3. **Processors Accumulators** (user-customizable) provide configuration to the **Apply pre-processing** step.
4. **Desired metrics** (user-customizable) provide specification to the **Calculate workload metrics** module.
5. The core **Benchmark Runtime** executes a sequence: Initialize metric calculations -> Load data -> Apply pre-processing -> Model inference -> Apply post-processing.
6. Outputs from the runtime sequence and the wrapper feed into two parallel calculation modules:
* **Calculate static metrics** (using input from the wrapper) produces **Static metrics** (Footprint, Connection sparsity).
* **Calculate workload metrics** (using input from the runtime sequence and Desired metrics) produces **Workload metrics** (Correctness, Activation sparsity, Synaptic operations).
**Color-Coding Verification:**
* Green (User-defined): Only the "Model" box.
* Orange (User-customizable): "Processors Accumulators" and "Desired metrics".
* Pink (Benchmark-defined): All other boxes, including the entire Benchmark Harness and Results sections, the Dataset Dataloader, and all steps within the Benchmark Runtime.
### Key Observations
* **Clear Separation of Concerns:** The framework distinctly separates user responsibilities (providing a model, optionally customizing processors and metrics) from the benchmark's automated processes (data loading, inference, metric calculation).
* **Two-Tier Metric Calculation:** Metrics are split into **Static** (likely model properties like size and sparsity, calculated once) and **Workload** (performance properties like accuracy and operations, calculated during runtime).
* **Centralized Runtime:** The "Benchmark Runtime" box encapsulates the core execution pipeline, emphasizing a standardized sequence for all benchmarks.
* **Wrapper Pattern:** The "NeuroBenchModel Wrapper" acts as an adapter, suggesting the framework standardizes the interface for different user models.
### Interpretation
This diagram outlines a structured, reproducible benchmarking system for computational models, particularly those where metrics like "Connection sparsity" and "Synaptic operations" are relevant (e.g., spiking neural networks or neuromorphic hardware).
The flow demonstrates a **Peircean investigative process**:
1. **Abduction (Hypothesis):** The user defines a **Model** and **Desired metrics**, forming a hypothesis about what to test and how to measure it.
2. **Deduction (Prediction):** The **Benchmark Harness** applies a fixed, logical process (the runtime sequence) to the model and data, predicting the outcomes based on the framework's rules.
3. **Induction (Testing):** The **Calculate** modules generate concrete **Static** and **Workload metrics** from the execution, providing empirical data.
4. **Abduction again (Inference):** By comparing the resulting metrics against expectations, the user can infer the model's strengths, weaknesses, and suitability for a target application or hardware.
The framework's design ensures that comparisons between different models are fair (same data loading, preprocessing, and inference pipeline) while allowing controlled customization of key variables (processors, specific metrics). The separation of static and workload metrics is crucial, as a model might be efficient in footprint (static) but perform poorly on a task (workload), or vice-versa. The entire system is built to expose these nuanced trade-offs.
DECODING INTELLIGENCE...